LabAssay (TM) Free Cholesterol
| Grade : | for Cellbiology |
| Storage Condition : | Keep at 2-10 degrees C. |


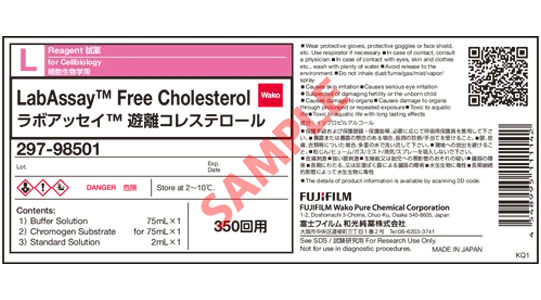
| Catalogue/Product Number | Package Size | COA Download |
|---|---|---|
|
297-98501
|
350Tests |

Document
Overview
Kit component
For 350 tests
| Buffer Solution | 75 mL/1 bottle |
|---|---|
| Chromogen Substrate | For 75 mL/1 bottle |
| Standard Solution | 2 mL/1 bottle |
Product Overview
In human blood, cholesterol is found primarily in LDL and HDL, with smaller amounts present in VLDL. Approximately two-thirds of total cholesterol exists in esterified form, while the remaining one-third is present as free cholesterol. Free cholesterol refers to cholesterol that is not bound to a fatty acid and plays an essential role in maintaining cell membrane fluidity, signal transduction, and hormone synthesis. Maintaining an appropriate balance between free and esterified cholesterol is critical for normal cell function, and any disruptions in this balance may indicate the presence of various diseases.
The cholesterol esterification ratio typically ranges from 70–80%. A reduced ratio is associated with conditions such as acute and chronic hepatitis, liver cirrhosis, nephrotic syndrome, and chronic inflammatory conditions.
LabAssay™ Free Cholesterol is a kit designed to measure free cholesterol in samples. With the use of a microplate, this kit provides a convenient method for measuring free cholesterol in samples.
[Note] LabAssay™ series are reagents for research purposes. They cannot be used for diagnostic purposes.
Kit Performance
| Analysis sample | Human Serum/Plasma (EDTA, heparin) Mouse Serum/Plasma (EDTA, heparin) Rat Serum/Plasma (EDTA, heparin) Dog Serum/Plasma (EDTA, heparin) Cat Serum/Plasma (EDTA, heparin) Culture medium (D-MEM, RPMI)* |
|---|---|
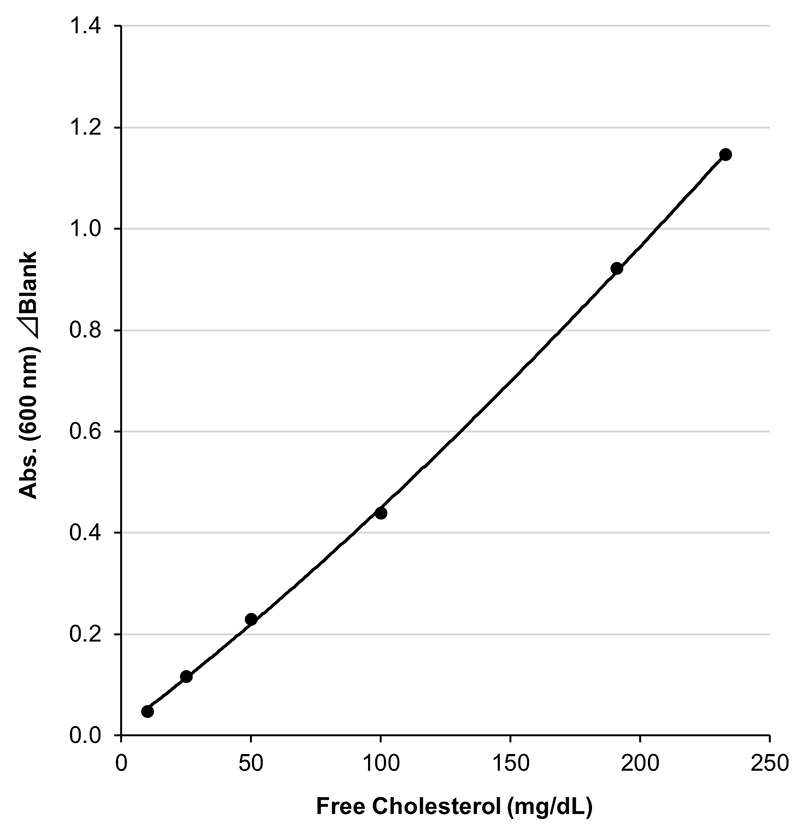
| Calibration curve range | 10-233 mg/dL |
| Sample volume | 10 μL |
| Measurement duration | Approx. 20 min. |
| Wavelength | 600 nm |
* It is tested by using the samples that standard substances have been added to the culture medium.
Measurement availability depends on the culture medium, cell type and culture conditions. Please perform a spiked recovery test or dilution linearity test in advance using the culture medium to be used in your experiment.
Example of Calibration Curve
Assay Principle
Upon addition of the color reagent to the sample, free cholesterol is oxidized by cholesterol oxidase (CO), generating hydrogen peroxide. The hydrogen peroxide then drives a quantitative oxidative condensation reaction between DAOS and 4-aminoantipyrine, catalyzed by peroxidase (POD), producing a blue pigment. The concentration of free cholesterol in the sample is determined by measuring the absorbance of the resulting blue color.

Data
Repeatability (within run precision)
Repeatability was conducted by measuring five-fold assays of serum/plasma (EDTA) samples from human at two concentrations with this product.
| n\ID | Human serum | Human plasma (EDTA) | ||
|---|---|---|---|---|
| ID1 (mg/dL) | ID2 (mg/dL) | ID3 (mg/dL) | ID4 (mg/dL) | |
| 1 | 35.3 | 145 | 39.8 | 137 |
| 2 | 36.1 | 146 | 39.4 | 140 |
| 3 | 35.9 | 145 | 39.9 | 139 |
| 4 | 35.5 | 146 | 39.8 | 140 |
| 5 | 35.5 | 146 | 39.4 | 138 |
| mean | 35.7 | 146 | 39.7 | 139 |
| SD | 0.329 | 0.548 | 0.241 | 1.30 |
| CV(%) | 0.9 | 0.4 | 0.6 | 0.9 |
[Result]
The CV (%) of human serum was 0.4-0.9%, human plasma (EDTA) was 0.6-0.9%, indicating good repeatability.
Reproducibility (between run precision)
Reproducibility was conducted by measuring serum/plasma (EDTA) samples from human at two concentrations each for four days with this product.
| Day\ID | Human serum | Human plasma (EDTA) | ||
|---|---|---|---|---|
| ID9 (mg/dL) | ID10 (mg/dL) | ID11 (mg/dL) | ID12 (mg/dL) | |
| 1 | 152 | 51.2 | 119 | 39.1 |
| 2 | 151 | 52.7 | 121 | 41.2 |
| 3 | 152 | 51.2 | 127 | 40.3 |
| 4 | 145 | 53.6 | 123 | 41.8 |
| mean | 150 | 52.2 | 123 | 40.6 |
| SD | 3.37 | 1.18 | 3.42 | 1.17 |
| CV(%) | 2.2 | 2.3 | 2.8 | 2.9 |
[Result]
The CV (%) of human serum was 2.2-2.3%, human plasma (EDTA) was 2.8-2.9%, indicating good reproducibility.
Dilution Linearity Test
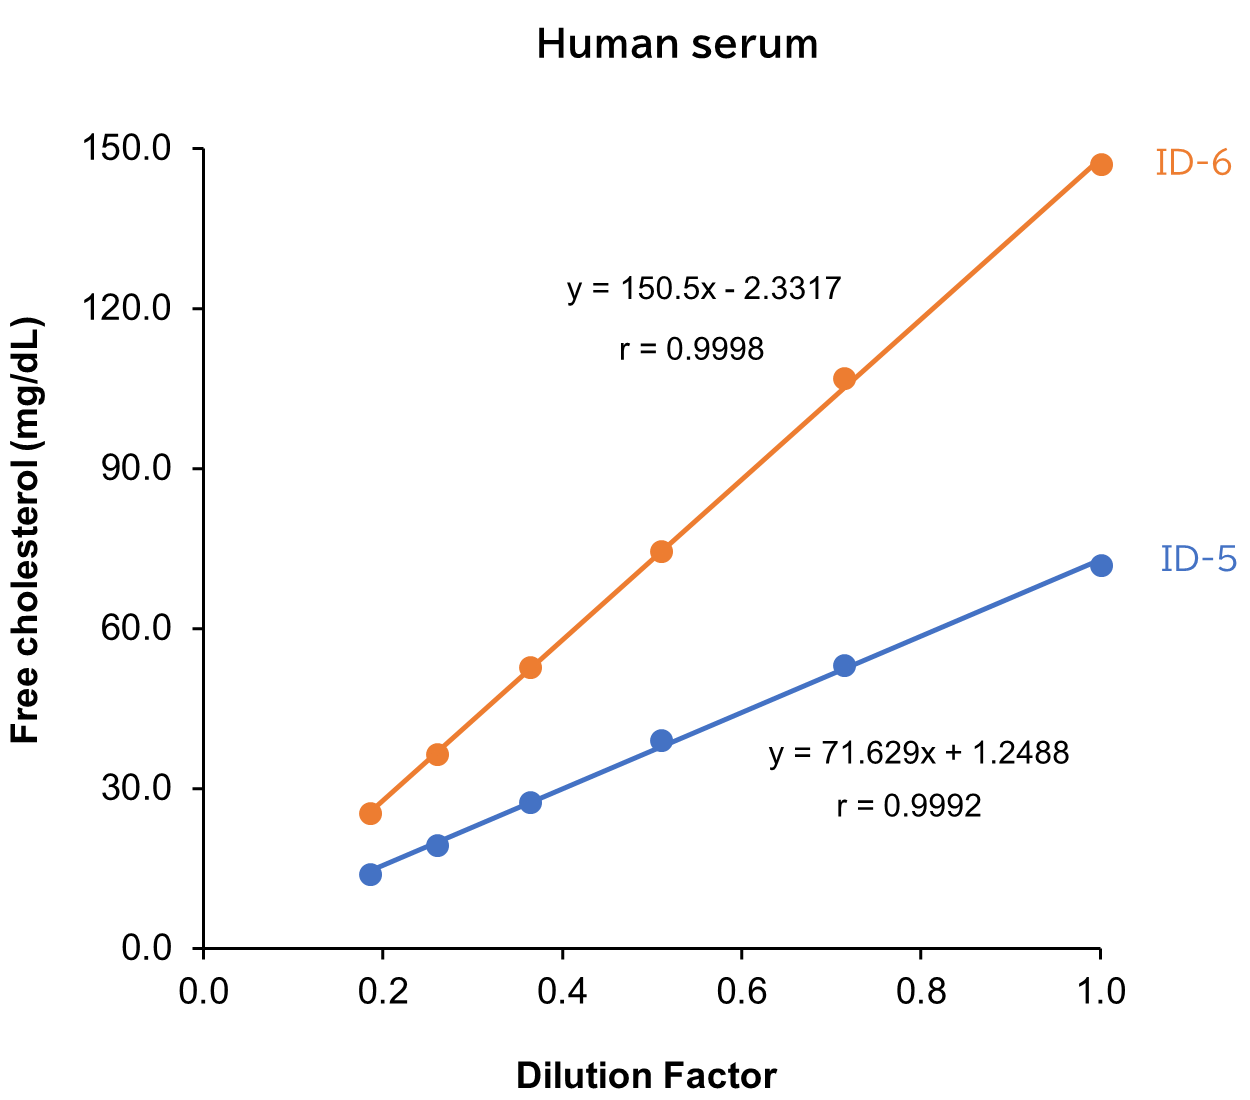
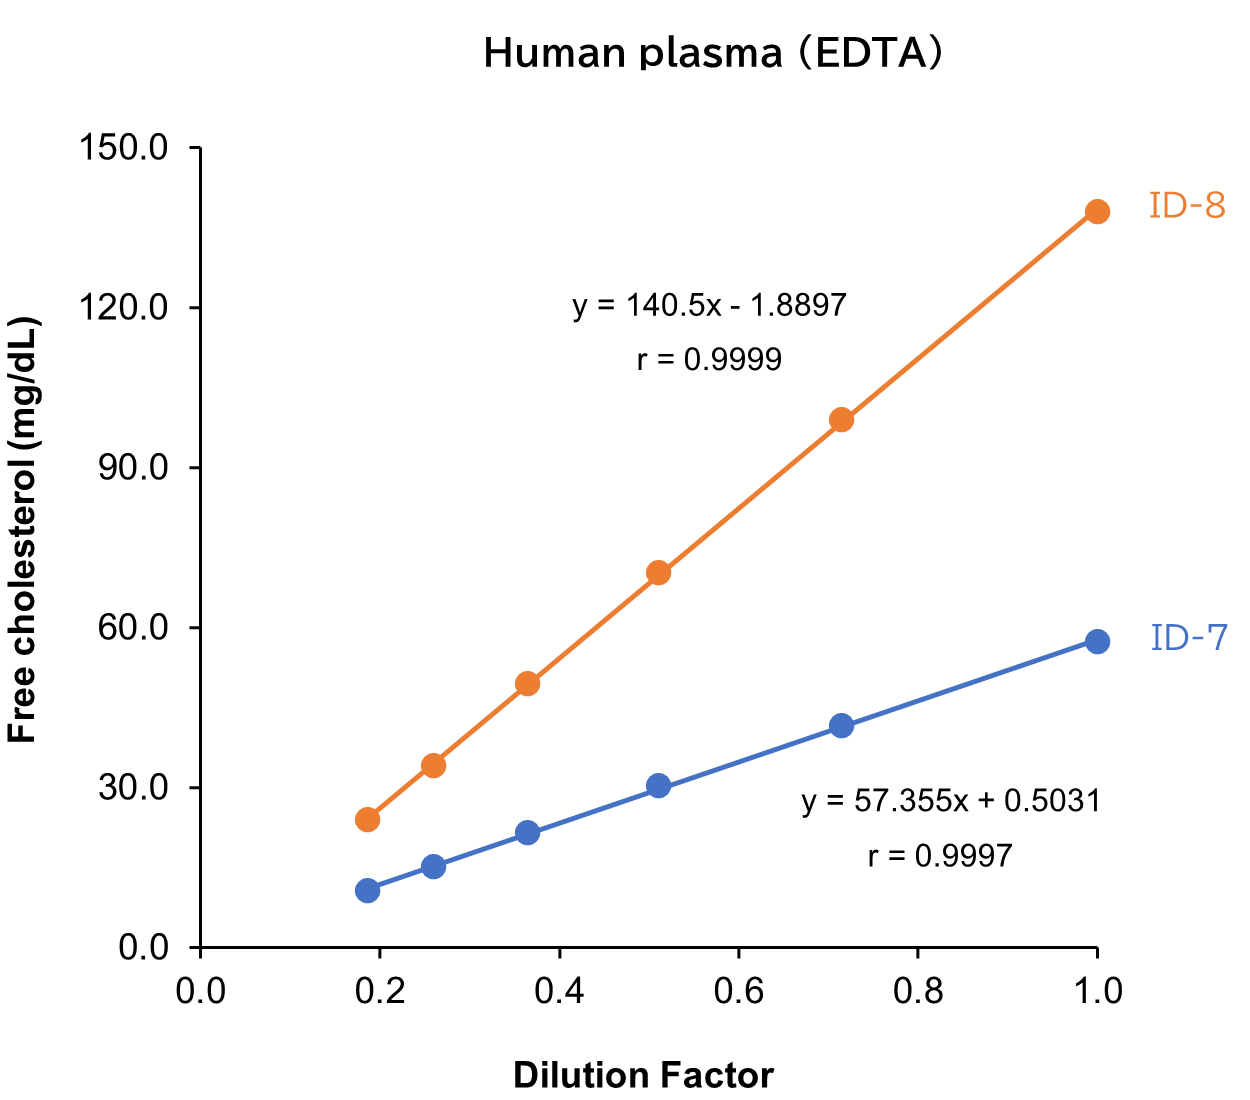
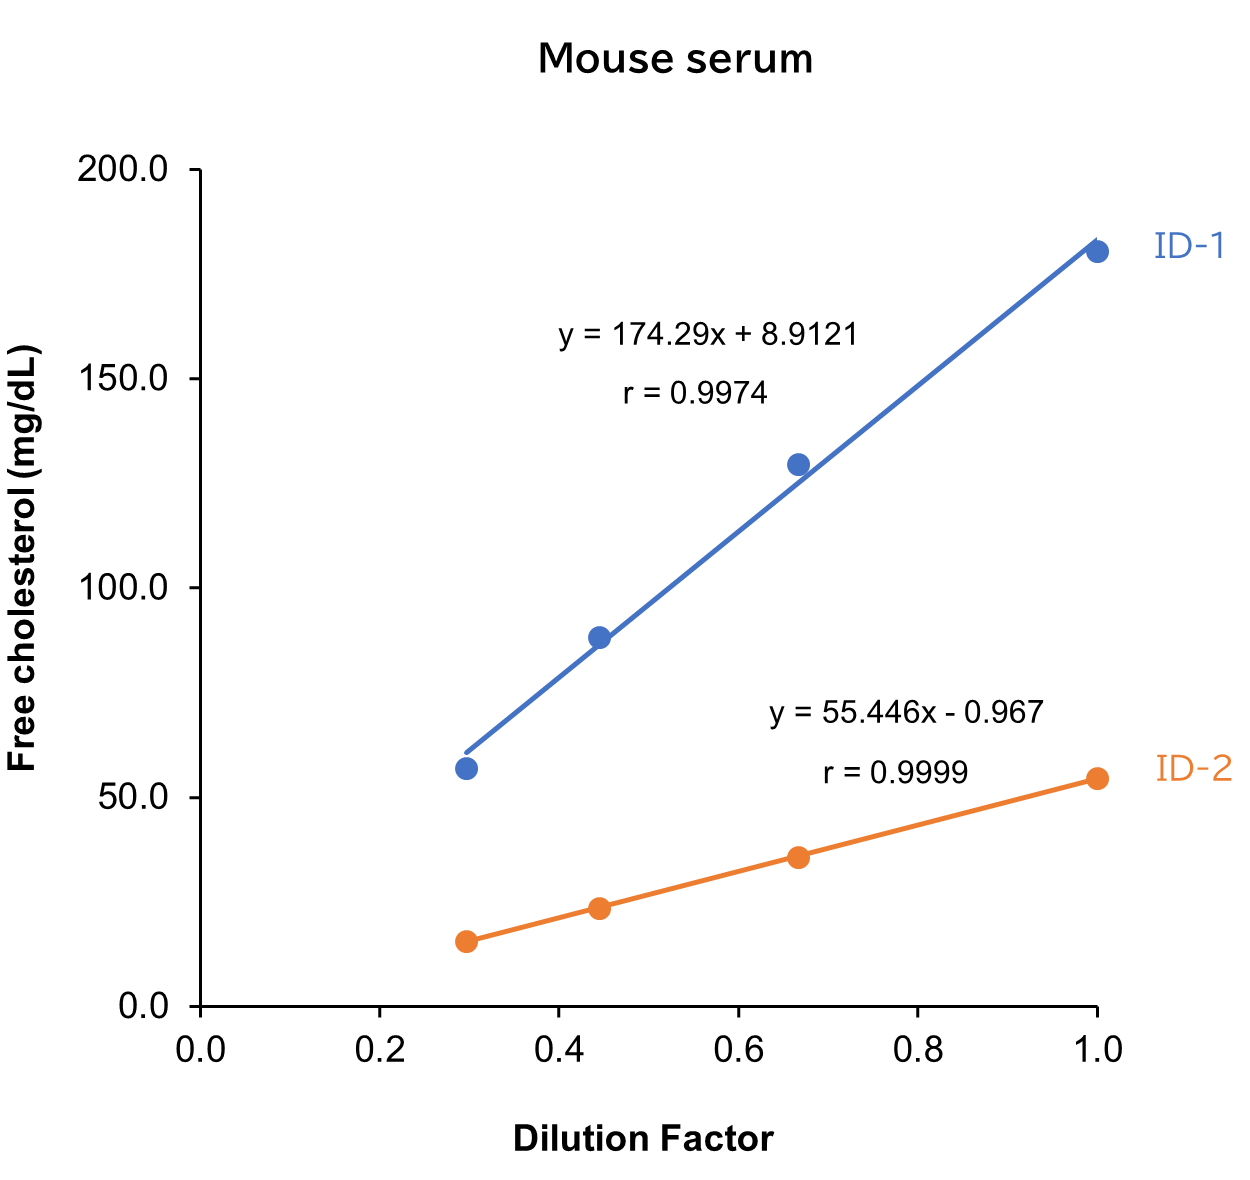
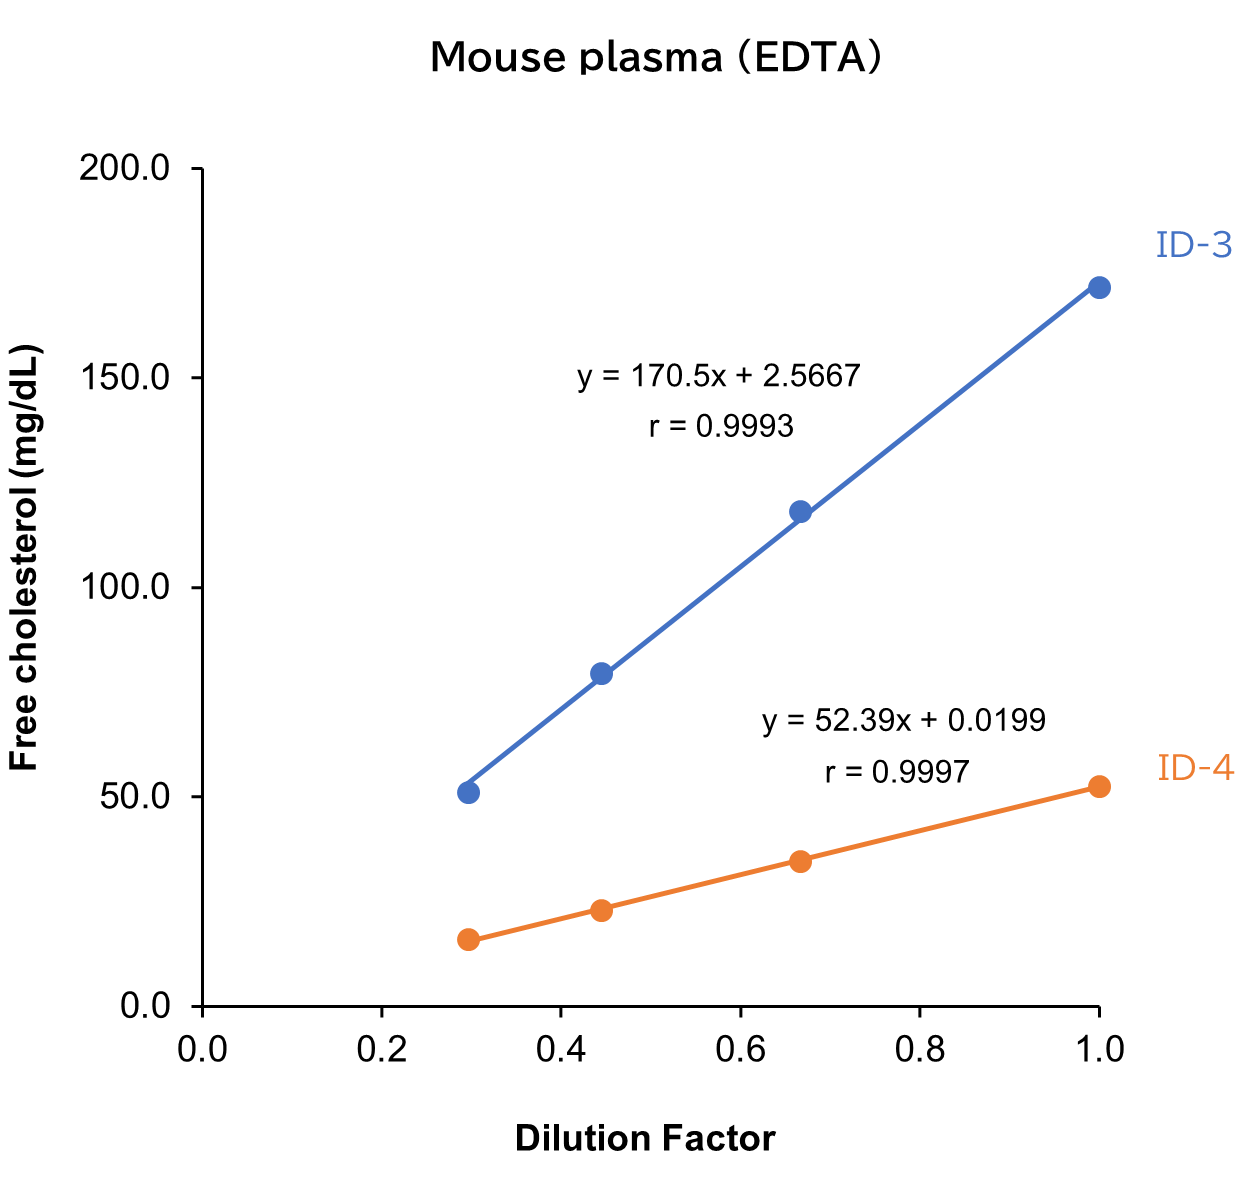
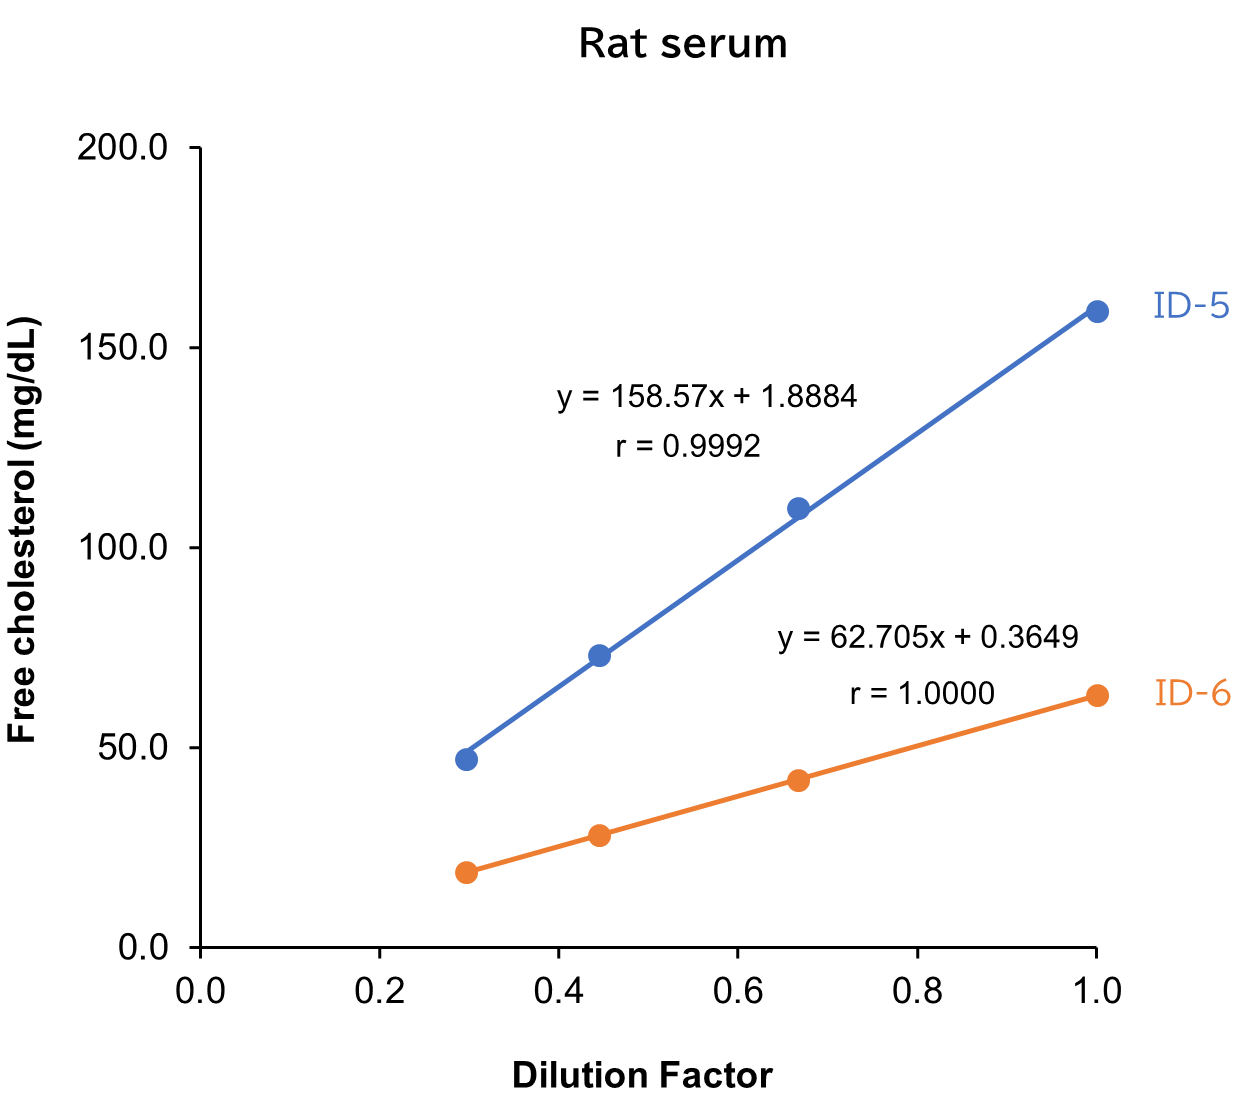
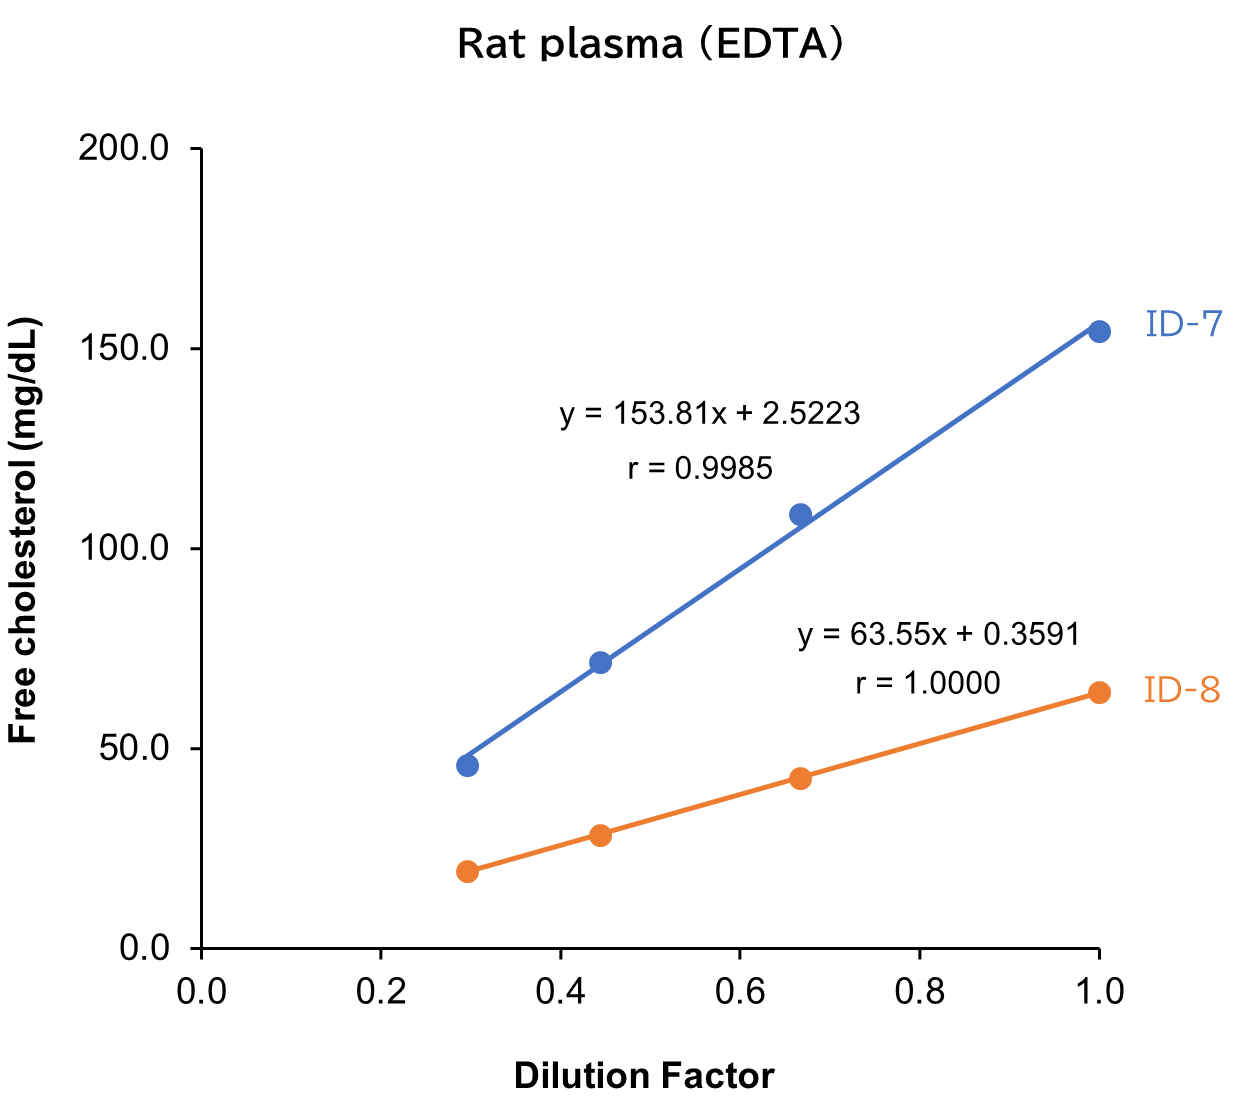
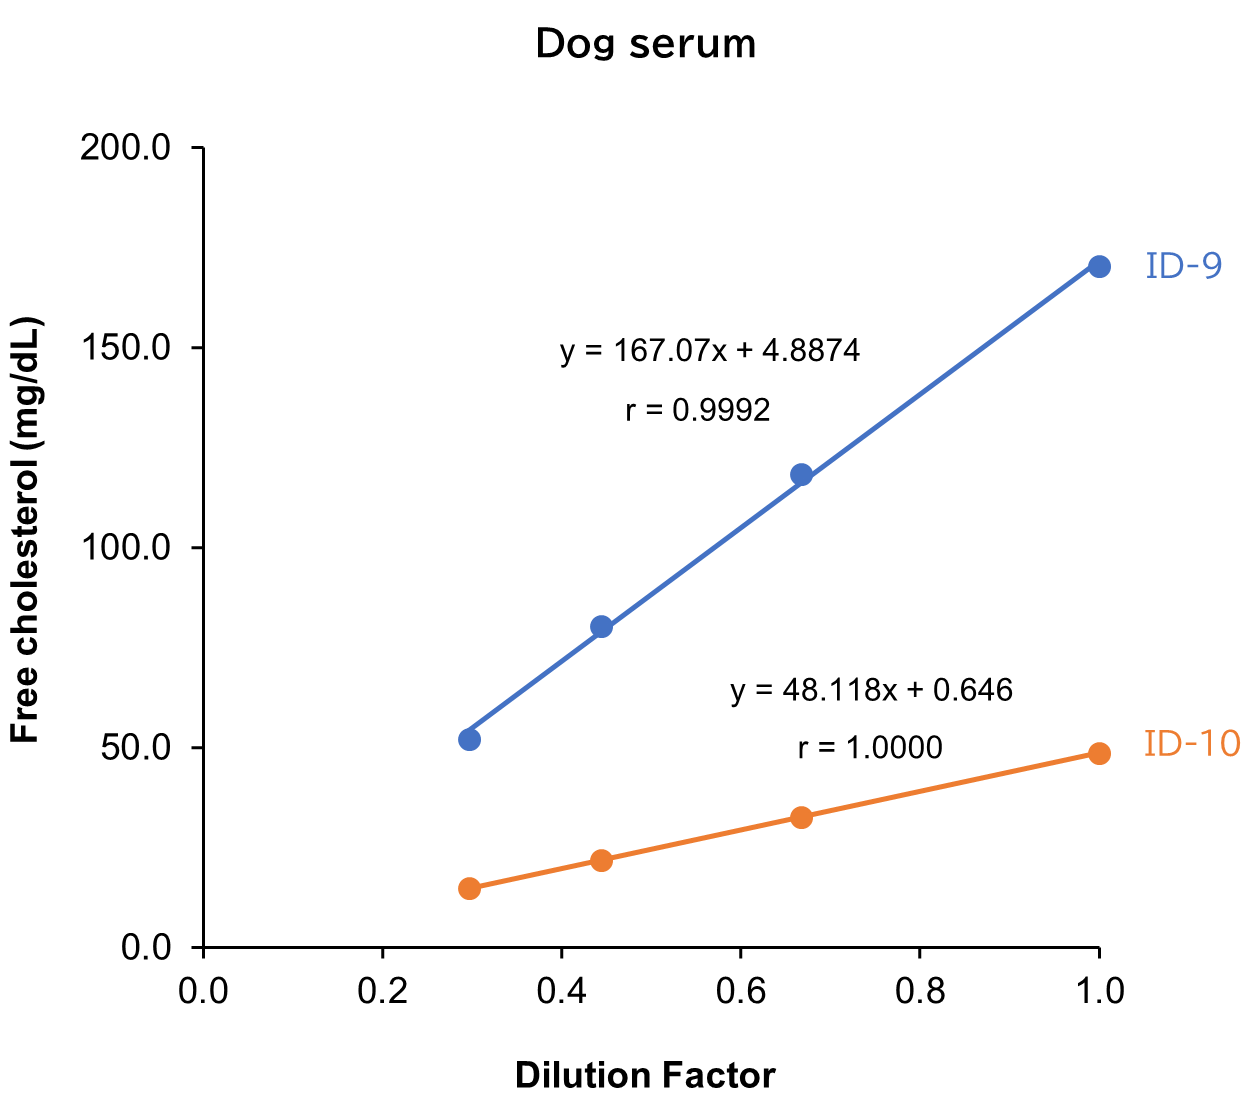
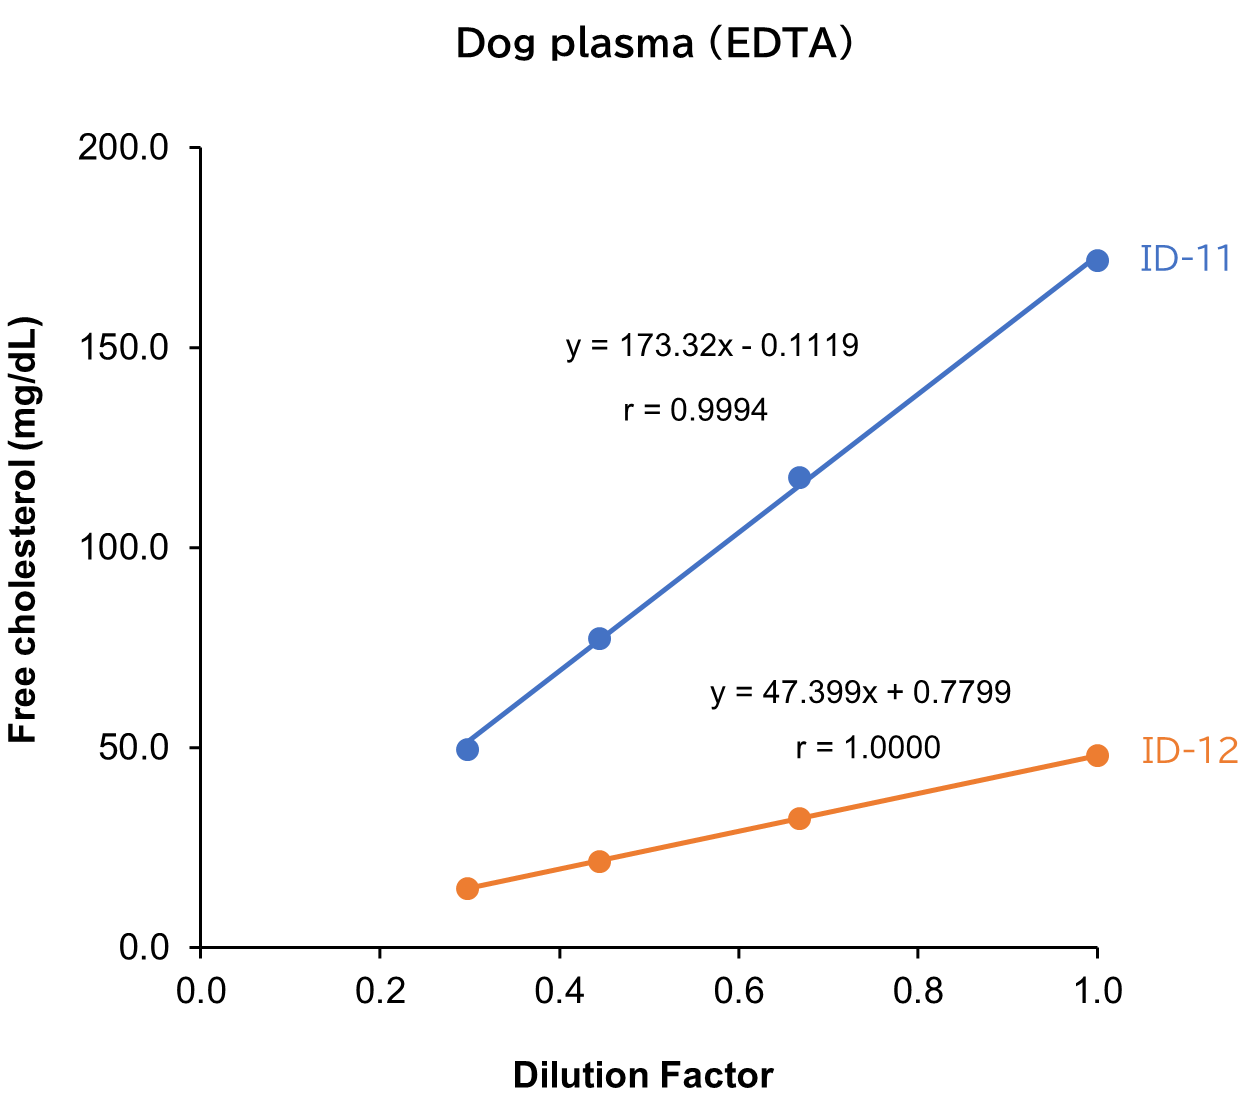
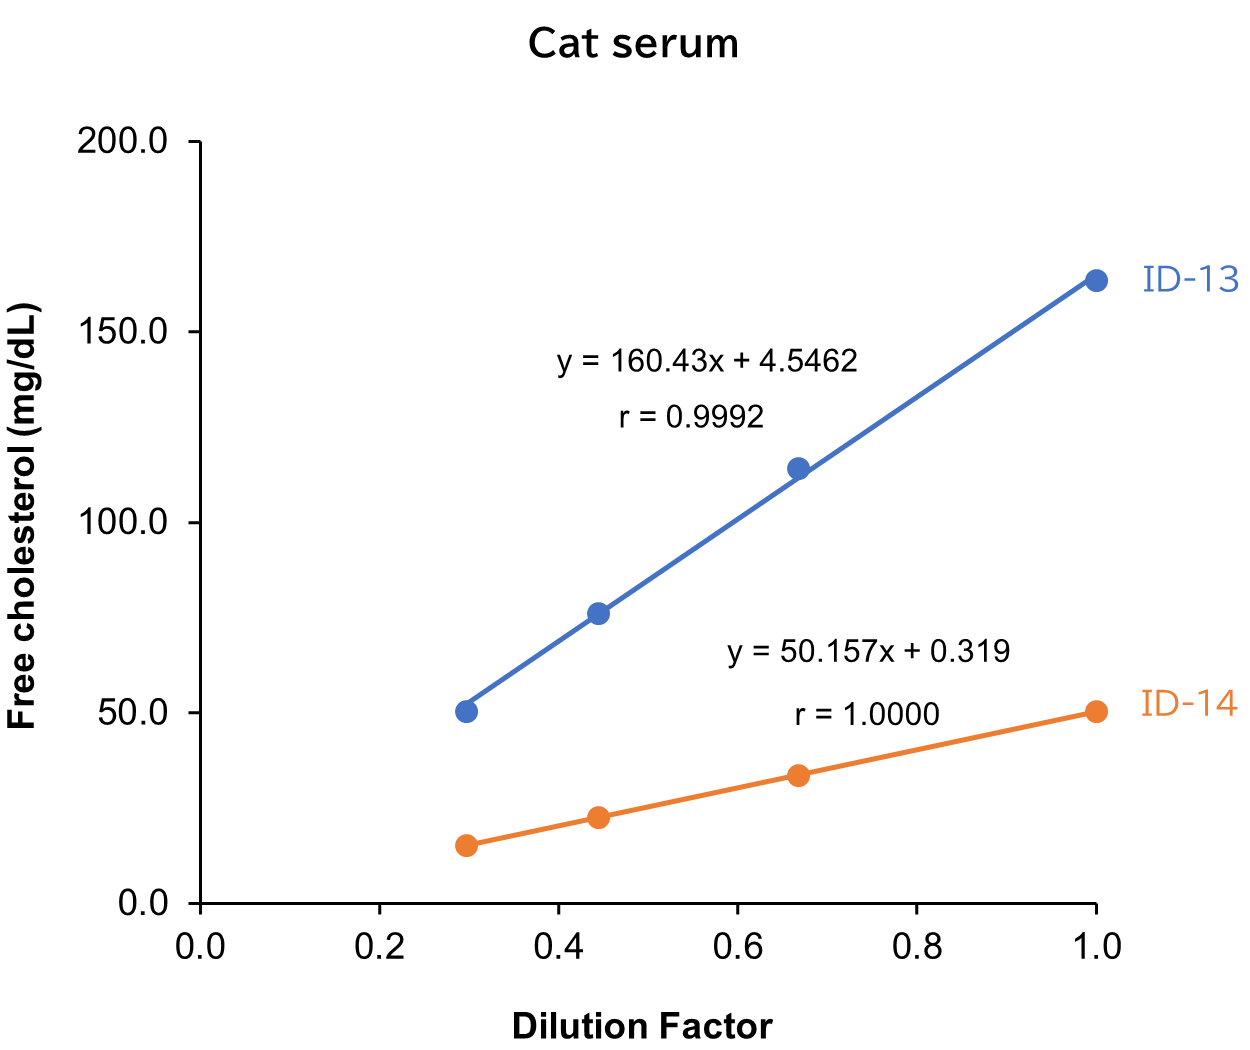
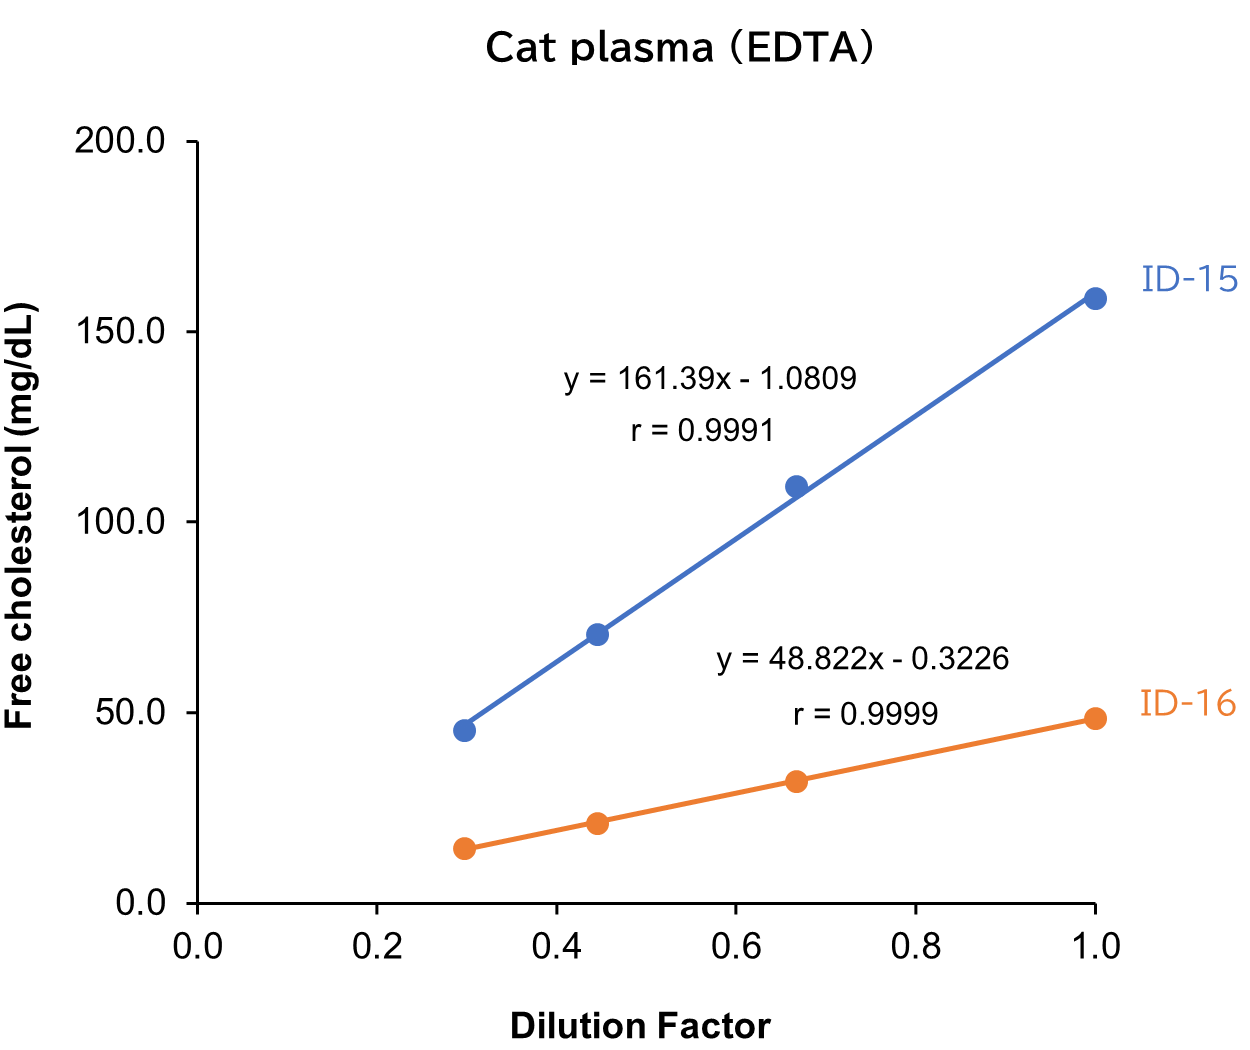
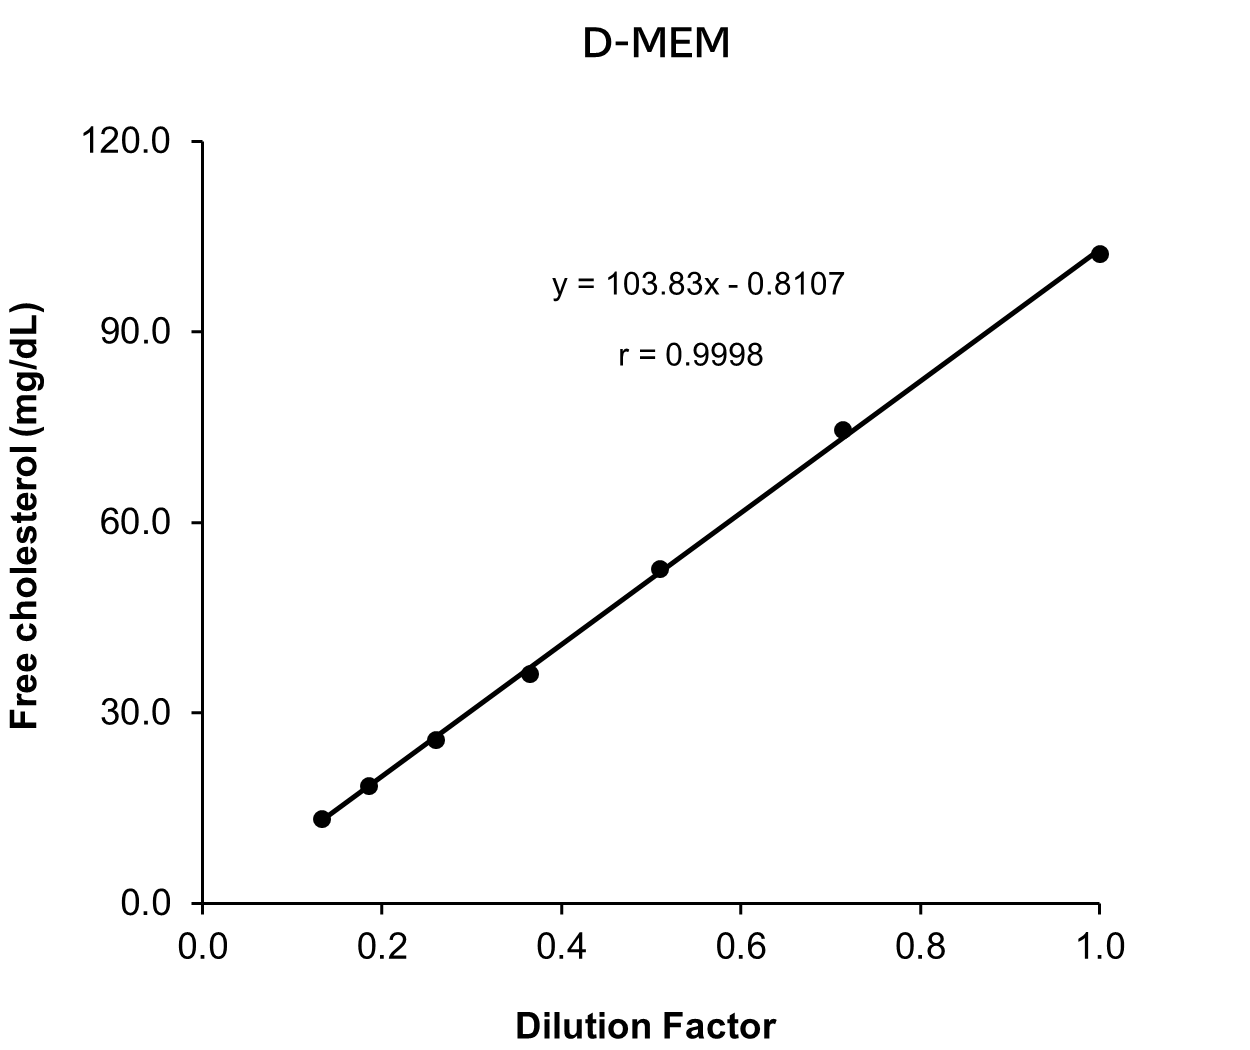
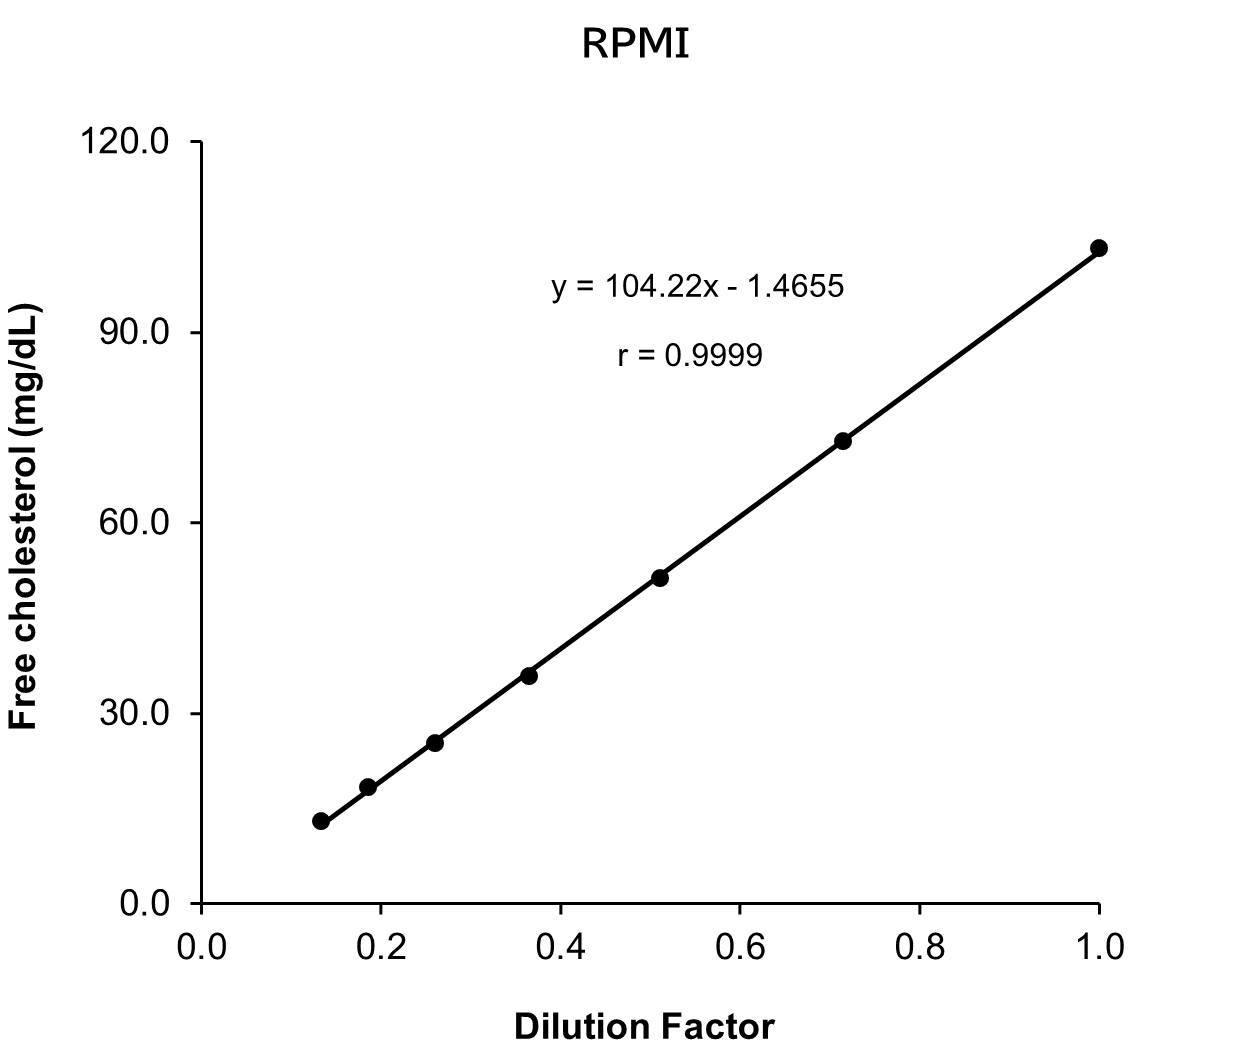
Serum and plasma (EDTA) from human, mouse, rat, dog and cat, as well as D-MEM and RPMI spiked with the standard, were serially diluted twofold with the buffer in this kit and measured in duplicate to assess linearity.
[Result]
All measurement results showed good linearity within the measurement range.
Spike and Recovery Test
Standard solutions at three concentrations were added to serum/plasma (EDTA) from human, mouse, rat, dog and cat as well as culture medium (D-MEM and RPMI). Next, spike recovery tests were conducted, with each measurement performed in duplicate.
Human sample
| Spiked amount (mg/dL) | Measurement value (mg/dL) | Recovery volume (mg/dL) | Recovery rate (%) | |
|---|---|---|---|---|
| Serum | - | 49.0 | - | - |
| 13.8 | 62.5 | 13.5 | 97.8 | |
| 27.7 | 77.5 | 28.5 | 103 | |
| 55.3 | 101 | 52.0 | 94.0 | |
| Average | 98.2 | |||
| Plasma (EDTA) | - | 41.3 | - | - |
| 10.3 | 50.8 | 9.50 | 92.2 | |
| 25.8 | 65.7 | 24.4 | 94.6 | |
| 51.6 | 89.7 | 48.4 | 93.8 | |
| Average | 93.5 | |||
Mouse sample (BALB/c)
| Spiked amount (mg/dL) | Measurement value (mg/dL) | Recovery volume (mg/dL) | Recovery rate (%) | |
|---|---|---|---|---|
| Serum | - | 18.9 | - | - |
| 12.6 | 30.6 | 11.7 | 92.9 | |
| 25.2 | 44.1 | 25.2 | 100 | |
| 50.3 | 72.5 | 53.6 | 107 | |
| Average | 99.8 | |||
| Plasma (EDTA) | - | 17.8 | - | - |
| 12.6 | 29.5 | 11.7 | 92.9 | |
| 25.2 | 43.6 | 25.8 | 102 | |
| 50.3 | 72.6 | 54.8 | 109 | |
| Average | 101 | |||
Rat sample (S.D. rat)
| Spiked amount (mg/dL) | Measurement value (mg/dL) | Recovery volume (mg/dL) | Recovery rate (%) | |
|---|---|---|---|---|
| Serum | - | 11.0 | - | - |
| 11.1 | 21.2 | 10.1 | 91.0 | |
| 22.1 | 31.4 | 20.4 | 92.3 | |
| 55.3 | 64.3 | 53.3 | 96.4 | |
| Average | 93.2 | |||
| Plasma (EDTA) | - | 10.4 | - | - |
| 11.1 | 20.6 | 10.2 | 91.9 | |
| 22.1 | 31.2 | 20.8 | 94.1 | |
| 55.3 | 62.4 | 52.0 | 94.0 | |
| Average | 93.3 | |||
Dog sample (Beagle)
| Spiked amount (mg/dL) | Measurement value (mg/dL) | Recovery volume (mg/dL) | Recovery rate (%) | |
|---|---|---|---|---|
| Serum | - | 31.7 | - | - |
| 11.4 | 42.4 | 10.7 | 93.9 | |
| 20.6 | 50.3 | 18.6 | 90.3 | |
| 51.4 | 82 | 50.3 | 97.9 | |
| Average | 94.0 | |||
| Plasma (EDTA) | - | 29.6 | - | - |
| 11.5 | 40.5 | 10.9 | 94.8 | |
| 20.6 | 49.0 | 19.4 | 94.2 | |
| 51.4 | 81.6 | 52.0 | 101 | |
| Average | 96.7 | |||
Cat sample (Japanese cat)
| Spiked amount (mg/dL) | Measurement value (mg/dL) | Recovery volume (mg/dL) | Recovery rate (%) | |
|---|---|---|---|---|
| Serum | - | 18.6 | - | - |
| 11.4 | 29.2 | 10.6 | 93.0 | |
| 20.6 | 37.5 | 18.9 | 91.7 | |
| 51.4 | 70.2 | 51.6 | 100 | |
| Average | 95.0 | |||
| Plasma (EDTA) | - | 18.8 | - | - |
| 11.4 | 29.4 | 10.6 | 93.0 | |
| 20.6 | 38.6 | 19.8 | 96.1 | |
| 51.4 | 71.2 | 52.4 | 102 | |
| Average | 97.0 | |||
Culture medium
| Spiked amount (mg/dL) | Measurement value (mg/dL) | Recovery volume (mg/dL) | Recovery rate (%) | |
|---|---|---|---|---|
| D-MEM | - | 0.0 | - | - |
| 10.6 | 10.8 | 10.8 | 102 | |
| 21.2 | 21.1 | 20.1 | 94.8 | |
| 53.0 | 52.0 | 52.0 | 98.1 | |
| Average | 98.3 | |||
| RPMI | - | 0.0 | - | - |
| 10.6 | 11.1 | 11.1 | 105 | |
| 21.2 | 20.5 | 20.5 | 96.7 | |
| 53.0 | 51.8 | 51.8 | 97.7 | |
| Average | 99.7 | |||
[Result]
Good recovery rates were confirmed.
Correlation with Automated Analyzer Reagents
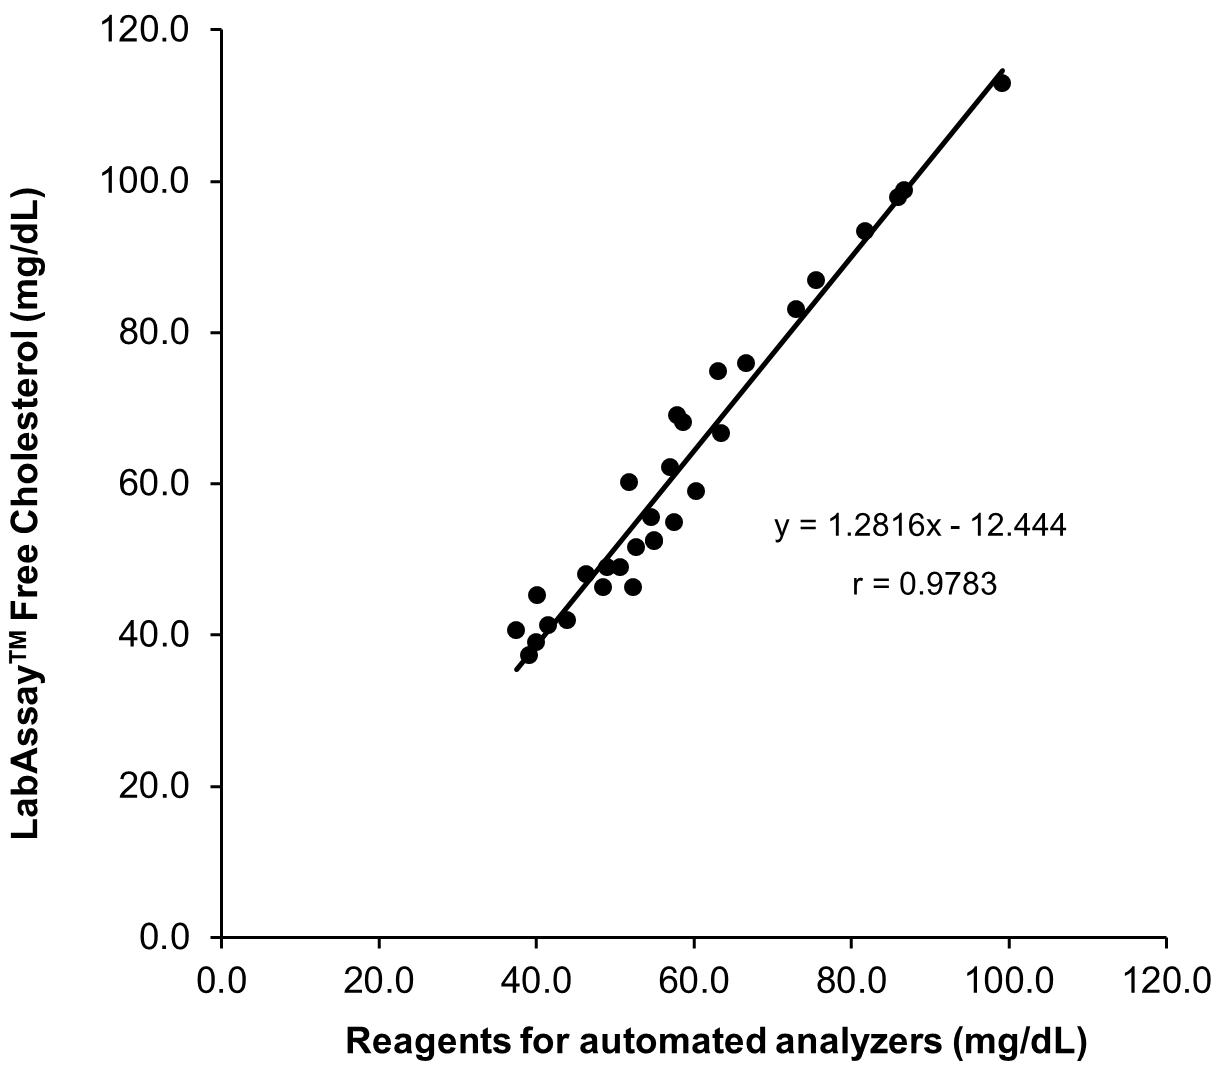
Free cholesterol levels in serum/plasma (EDTA) samples from human were measured using LabAssay™ Free Cholesterol and reagents for automated analyzers, and the correlation between the two sets of results was evaluated.
[Result]
A strong correlation was confirmed between the values obtained with LabAssay™ Free Cholesterol and those obtained using reagents for automated analyzers.
Measurement Using Actual Samples
Mouse sample (BALB/c)
| ID\n | Measurement value (mg/dL) | mean | SD | CV (%) | ||
|---|---|---|---|---|---|---|
| 1 | 2 | |||||
| Serum | ID1 | 17.1 | 16.5 | 16.8 | 0.424 | 2.5 |
| ID2 | 16.0 | 15.2 | 15.6 | 0.566 | 3.6 | |
| ID3 | 7.65 | 7.60 | 7.63 | 0.0354 | 0.5 | |
| ID4 | 21.8 | 21.2 | 21.5 | 0.424 | 2.0 | |
| ID5 | 33.8 | 33.4 | 33.6 | 0.283 | 0.8 | |
| Plasma (EDTA) | ID1 | 14.3 | 14.7 | 14.5 | 0.283 | 2.0 |
| ID2 | 10.5 | 10.6 | 10.6 | 0.0707 | 0.7 | |
| ID3 | 15.4 | 15.5 | 15.5 | 0.0707 | 0.5 | |
| ID4 | 19.1 | 19.0 | 19.1 | 0.0707 | 0.4 | |
| ID5 | 30.8 | 30.7 | 30.8 | 0.0707 | 0.2 | |
Rat sample (S.D. rat)
| ID\n | Measurement value (mg/dL) | mean | SD | CV (%) | ||
|---|---|---|---|---|---|---|
| 1 | 2 | |||||
| Serum | ID1 | 28.5 | 28.4 | 28.5 | 0.0707 | 0.2 |
| ID2 | 17.6 | 17.5 | 17.6 | 0.0707 | 0.4 | |
| ID3 | 19.4 | 19.3 | 19.4 | 0.0707 | 0.4 | |
| ID4 | 28.4 | 28.2 | 28.3 | 0.141 | 0.5 | |
| ID5 | 19.0 | 19.0 | 19.0 | 0.00 | 0.0 | |
| Plasma (EDTA) | ID1 | 13.4 | 13.5 | 13.5 | 0.0707 | 0.5 |
| ID2 | 12.4 | 12.2 | 12.3 | 0.141 | 1.1 | |
| ID3 | 14.5 | 13.9 | 14.2 | 0.424 | 3.0 | |
| ID4 | 28.5 | 28.3 | 28.4 | 0.141 | 0.5 | |
| ID5 | 19.5 | 19.2 | 19.4 | 0.212 | 1.1 | |
Dog sample (Beagle)
| ID\n | Measurement value (mg/dL) | mean | SD | CV (%) | ||
|---|---|---|---|---|---|---|
| 1 | 2 | |||||
| Serum | ID1 | 28.2 | 27.3 | 27.8 | 0.636 | 2.3 |
| ID2 | 19.5 | 19.2 | 19.4 | 0.212 | 1.1 | |
| ID3 | 27.8 | 25.1 | 26.5 | 1.91 | 7.2 | |
| ID4 | 28.8 | 28.5 | 28.7 | 0.212 | 0.7 | |
| ID5 | 18.4 | 18.6 | 18.5 | 0.141 | 0.8 | |
| Plasma (EDTA) | ID1 | 29.0 | 28.4 | 28.7 | 0.424 | 1.5 |
| ID2 | 33.8 | 33.5 | 33.7 | 0.212 | 0.6 | |
| ID3 | 39.4 | 39.5 | 39.5 | 0.0707 | 0.2 | |
| ID4 | 26.3 | 25.8 | 26.1 | 0.354 | 1.4 | |
| ID5 | 17.0 | 17.0 | 17.0 | 0.00 | 0.0 | |
Cat sample (Japanese cat)
| ID\n | Measurement value (mg/dL) | mean | SD | CV (%) | ||
|---|---|---|---|---|---|---|
| 1 | 2 | |||||
| Serum | ID1 | 22.6 | 21.9 | 22.3 | 0.495 | 2.2 |
| ID2 | 14.5 | 14.4 | 14.5 | 0.0707 | 0.5 | |
| ID3 | 11.6 | 11.5 | 11.6 | 0.0707 | 0.6 | |
| ID4 | 15.3 | 15.4 | 15.4 | 0.0707 | 0.5 | |
| ID5 | 22.5 | 22.8 | 22.7 | 0.212 | 0.9 | |
| Plasma (EDTA) | ID1 | 21.9 | 21.4 | 21.7 | 0.354 | 1.6 |
| ID2 | 10.2 | 10.3 | 10.3 | 0.0707 | 0.7 | |
| ID3 | 14.4 | 14.2 | 14.3 | 0.141 | 1.0 | |
| ID4 | 21.1 | 21.1 | 21.1 | 0.00 | 0.0 | |
| ID5 | 14.5 | 14.2 | 14.4 | 0.212 | 1.5 | |
Example of Calculating the Cholesterol Esterification Ratio
The cholesterol esterification ratio in blood can be determined by using LabAssay™ Free Cholesterol (this product) in conjunction with LabAssay™ Cholesterol (Product No. 293-93601). The esterification ratio represents the percentage of cholesterol esters relative to total cholesterol, with cholesterol esters calculated as total cholesterol minus free cholesterol. The formula is shown below, along with representative calculations for human, mouse, rat, dog, and cat samples.
![[Formula]](https://labchem-wako.fujifilm.com/us/product_data/images/04965746_img16.png)
Human sample
| Sample | No. | Total cholesterol* (mg/dL) | Free cholesterol (mg/dL) | Cholesterol esters (mg/dL) | Cholesterol esterification ratio |
|---|---|---|---|---|---|
| Serum | 1 | 119 | 36.0 | 83.0 | 69.7 |
| 2 | 163 | 48.2 | 115 | 70.5 | |
| 3 | 152 | 47.3 | 105 | 68.9 | |
| Plasma (EDTA) | 4 | 184 | 50.1 | 134 | 72.8 |
| 5 | 141 | 41.2 | 99.8 | 70.9 | |
| 6 | 162 | 51.2 | 111 | 68.5 |
Mouse sample (BALB/c)
| Sample | No. | Total cholesterol* (mg/dL) | Free cholesterol (mg/dL) | Cholesterol esters (mg/dL) | Cholesterol esterification ratio |
|---|---|---|---|---|---|
| Serum | 1 | 88.0 | 16.8 | 71.2 | 80.9 |
| 2 | 78.7 | 15.6 | 63.1 | 80.1 | |
| 3 | 43.6 | 7.62 | 36.0 | 82.5 | |
| Plasma (EDTA) | 4 | 33.7 | 14.5 | 19.2 | 57.0 |
| 5 | 45.0 | 10.6 | 34.4 | 76.5 | |
| 6 | 35.9 | 15.5 | 20.4 | 57.0 |
Rat sample (S.D. rat)
| Sample | No. | Total cholesterol* (mg/dL) | Free cholesterol (mg/dL) | Cholesterol esters (mg/dL) | Cholesterol esterification ratio |
|---|---|---|---|---|---|
| Serum | 1 | 93.6 | 28.4 | 65.2 | 69.6 |
| 2 | 64.6 | 17.5 | 47.1 | 72.9 | |
| 3 | 65.7 | 19.3 | 58.1 | 70.5 | |
| Plasma (EDTA) | 4 | 59.0 | 13.5 | 45.5 | 77.2 |
| 5 | 42.6 | 12.3 | 30.3 | 71.2 | |
| 6 | 51.2 | 14.2 | 37.0 | 72.3 |
Dog sample (Beagle)
| Sample | No. | Total cholesterol* (mg/dL) | Free cholesterol (mg/dL) | Cholesterol esters (mg/dL) | Cholesterol esterification ratio |
|---|---|---|---|---|---|
| Serum | 1 | 153 | 27.8 | 125 | 81.9 |
| 2 | 96.2 | 19.4 | 76.8 | 79.9 | |
| 3 | 117 | 26.5 | 109 | 77.3 | |
| Plasma (EDTA) | 4 | 129 | 28.7 | 100 | 77.8 |
| 5 | 142 | 33.6 | 108 | 76.3 | |
| 6 | 173 | 39.5 | 134 | 77.2 |
Cat sample (Japanese cat)
| Sample | No. | Total cholesterol* (mg/dL) | Free cholesterol (mg/dL) | Cholesterol esters (mg/dL) | Cholesterol esterification ratio |
|---|---|---|---|---|---|
| Serum | 1 | 103 | 22.2 | 80.8 | 78.5 |
| 2 | 81.5 | 14.4 | 67.1 | 82.3 | |
| 3 | 91.5 | 11.6 | 83.9 | 87.4 | |
| Plasma (EDTA) | 4 | 84.1 | 21.7 | 62.4 | 74.3 |
| 5 | 48.2 | 10.2 | 38.0 | 78.8 | |
| 6 | 73.4 | 14.3 | 59.1 | 80.5 |
- Total cholesterol was measured using our LabAssay™ Cholesterol (Product No. 293-93601).