LabAssay™ Total Protein
| Grade : | for Cellbiology |
| Storage Condition : | Keep at 2-10 degrees C. |


| Catalogue/Product Number | Package Size | COA Download |
|---|---|---|
|
295-98801
|
250Tests |

Document
Overview
Kit component
For 250 tests
| Chromogen Reagent | 65 mL/1 bottle |
|---|---|
| Standard | 1 bottle |
Product Overview
Total protein in serum (or plasma) consists primarily of albumin and globulin. It plays an important role in regulating osmotic pressure and transporting substances throughout the body. Abnormal total protein levels can serve as indicators of conditions such as liver disease, kidney disease, and chronic inflammation. By measuring both total protein and albumin concentrations, the albumin-to-globulin ratio (A/G ratio) can be determined. The A/G ratio is recognized as a useful marker for a variety of conditions including liver disease, kidney disease, nutritional disorders, multiple myeloma, and chronic inflammatory conditions. For this reason. total protein and albumin are commonly measured together.
This kit measures total protein in samples using the Biuret method, enabling rapid quantification of total protein.
[Note] LabAssay™ series are reagents for research purposes. They cannot be used for diagnostic purposes.
Kit Performance
| Analysis sample | Human Serum/Plasma (EDTA, heparin) Mouse Serum/Plasma (EDTA, heparin) Rat Serum/Plasma (EDTA, heparin) Dog Serum/Plasma (EDTA, heparin) Cat Serum/Plasma (EDTA, heparin) Culture medium (D-MEM, RPMI)* |
|---|---|
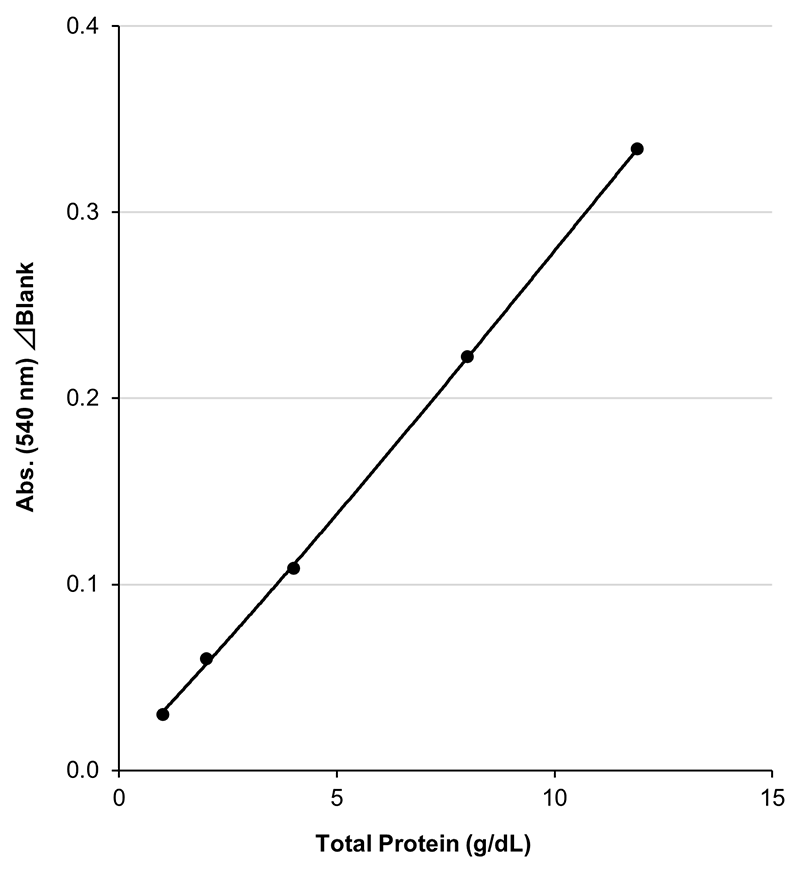
| Calibration curve range | 1.0-11.9 g/dL |
Sample volume | 5 μL |
| Measurement duration | Approx. 30 min |
| Wavelength | 540 nm |
*It is tested by using the samples that standard substances have been added to the culture medium.
Measurement availability depends on the culture medium, cell type and culture conditions. Please perform a spiked recovery test or dilution linearity test in advance usingthe culture medium to be used in your experiment.
Example of Calibration Curve
Assay Principle
When the total protein chromogenic reagent is applied to the sample, the proteins in the sample form complexes with copper ions, producing a blue-purple color. The total protein concentration in the sample is determined by measuring the absorbance of the resulting blue-purple color. (Biuret method)
Data
Repeatability (within run precision)
Repeatability was conducted by measuring five-fold assays of serum/plasma (EDTA) samples from human at two concentrations with this product.
| n\ID | Human serum | Human plasma (EDTA) | ||
|---|---|---|---|---|
| ID1 (g/dL) | ID2 (g/dL) | ID3 (g/dL) | ID4 (g/dL) | |
| 1 | 6.96 | 9.65 | 7.08 | 9.73 |
| 2 | 6.89 | 9.78 | 7.05 | 9.61 |
| 3 | 6.96 | 9.78 | 6.95 | 10.0 |
| 4 | 7.00 | 9.11 | 6.86 | 9.65 |
| 5 | 6.99 | 10.0 | 6.83 | 9.55 |
| mean | 6.96 | 9.66 | 6.95 | 9.71 |
| SD | 0.0430 | 0.334 | 0.111 | 0.176 |
| CV(%) | 0.6 | 3.5 | 1.6 | 1.8 |
[Result]
The CV (%) of human serum was 0.6-3.5% and human plasma (EDTA) was 1.6-1.8%, indicating good repeatability.
Reproducibility (between run precision)
Reproducibility was conducted by measuring serum/plasma (EDTA) samples from human at two concentrations each for four days with this product.
| Day\ID | Human serum | Human plasma (EDTA) | ||
|---|---|---|---|---|
| ID9 (g/dL) | ID10 (g/dL) | ID11 (g/dL) | ID12 (g/dL) | |
| 1 | 10.1 | 6.96 | 9.77 | 6.89 |
| 2 | 10.7 | 7.05 | 9.85 | 6.71 |
| 3 | 10.4 | 7.11 | 9.95 | 6.81 |
| 4 | 10.1 | 6.90 | 9.70 | 6.56 |
| mean | 10.3 | 7.01 | 9.82 | 6.74 |
| SD | 0.287 | 0.0933 | 0.108 | 0.142 |
| CV(%) | 2.8 | 1.3 | 1.1 | 2.1 |
[Result]
The CV (%) of human serum was 1.3-2.8%, and human plasma (EDTA) was 1.1-2.1%, indicating good reproducibility.
Dilution Linearity Test
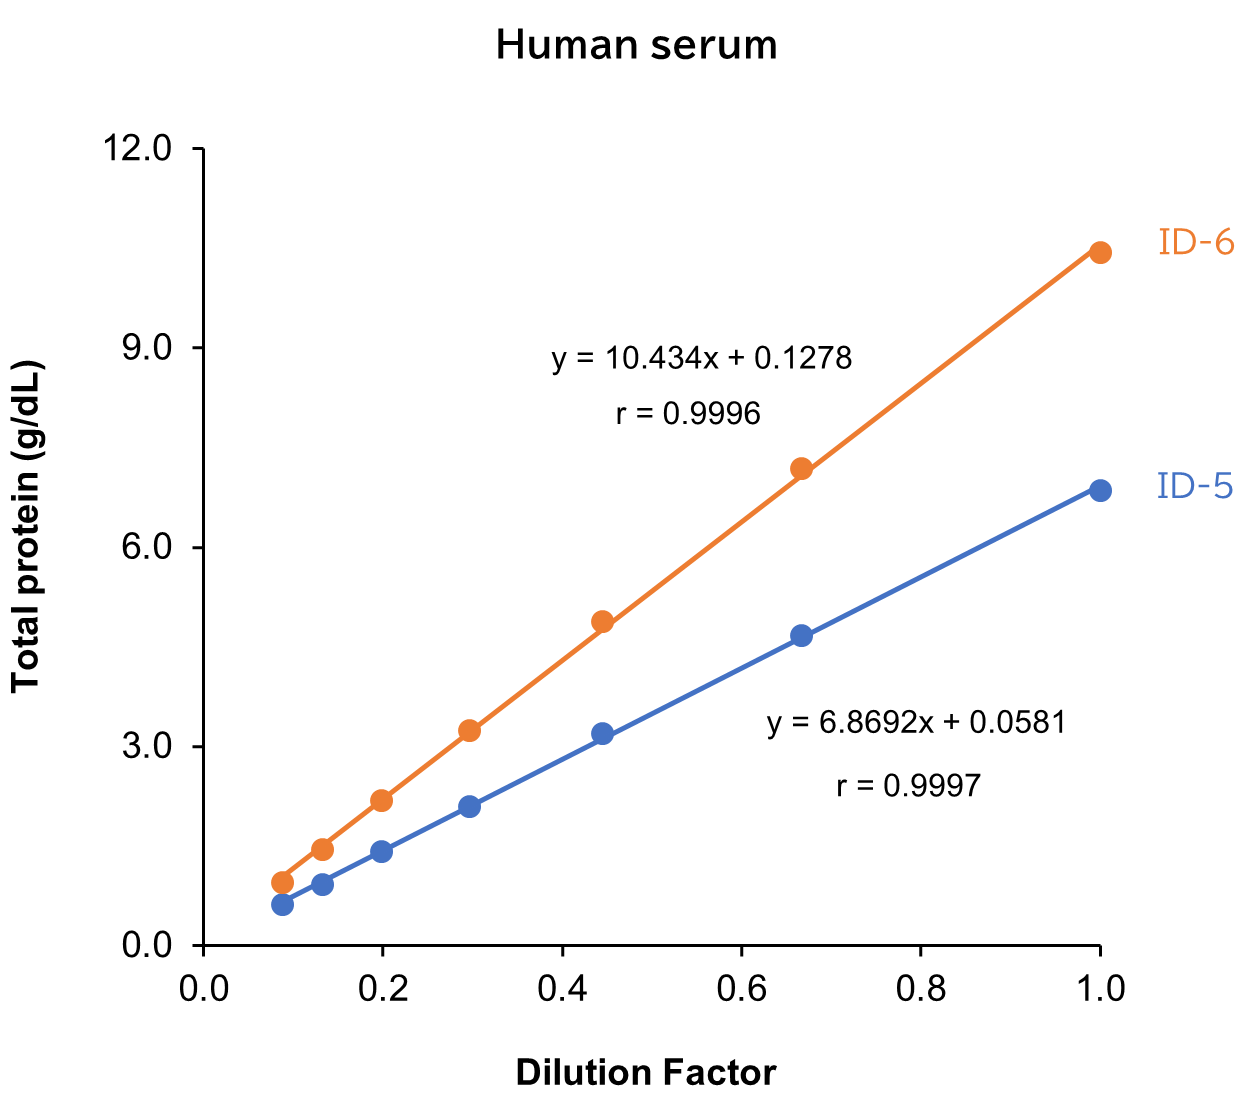
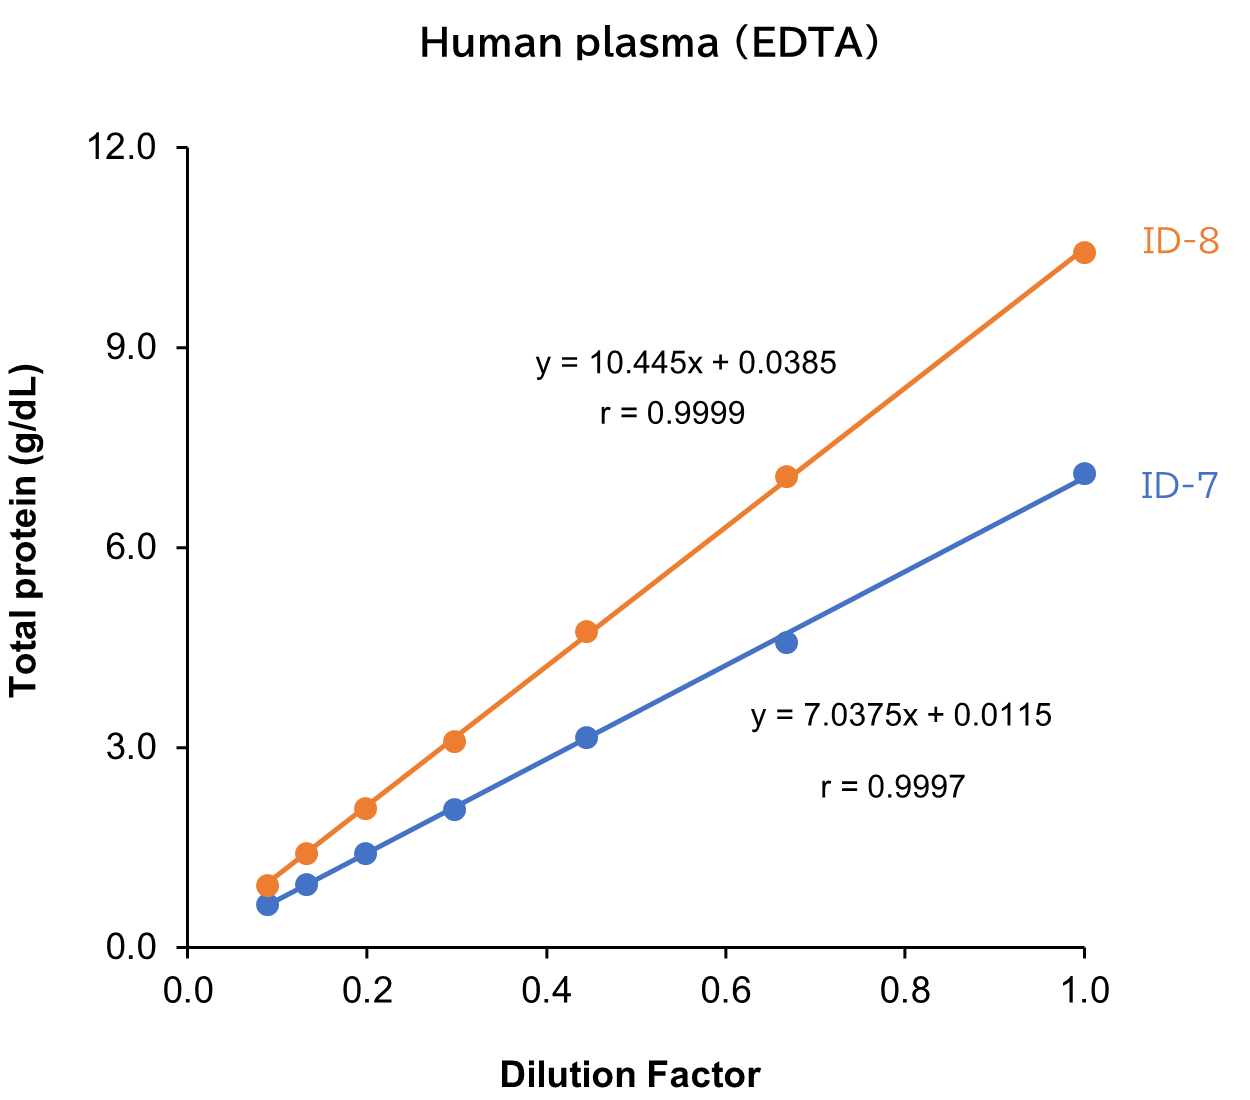
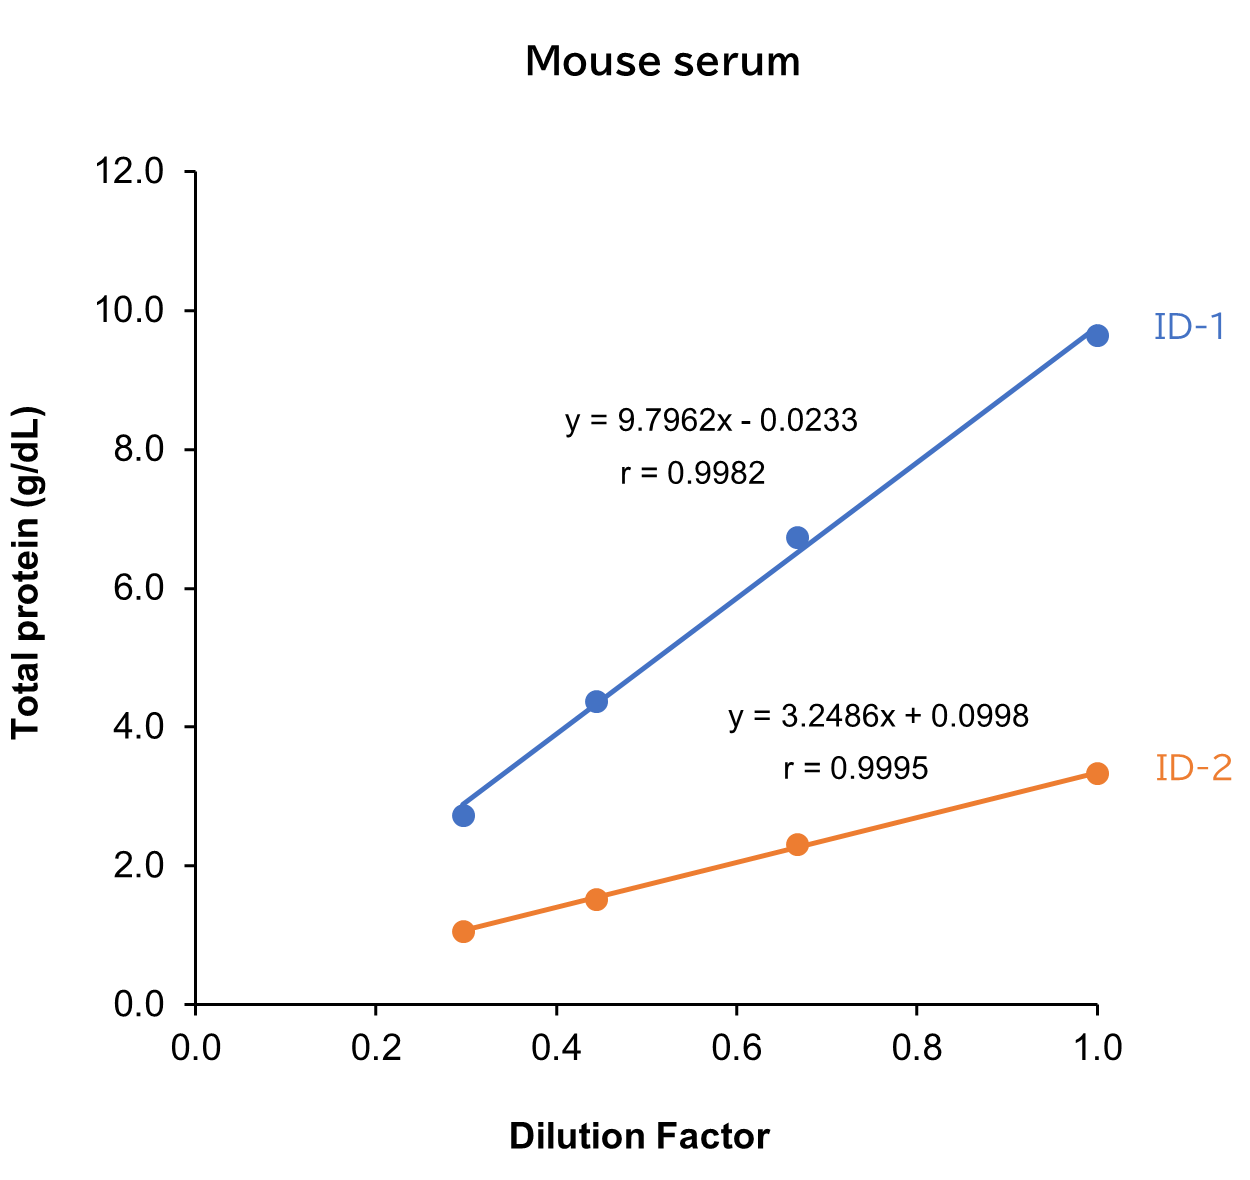
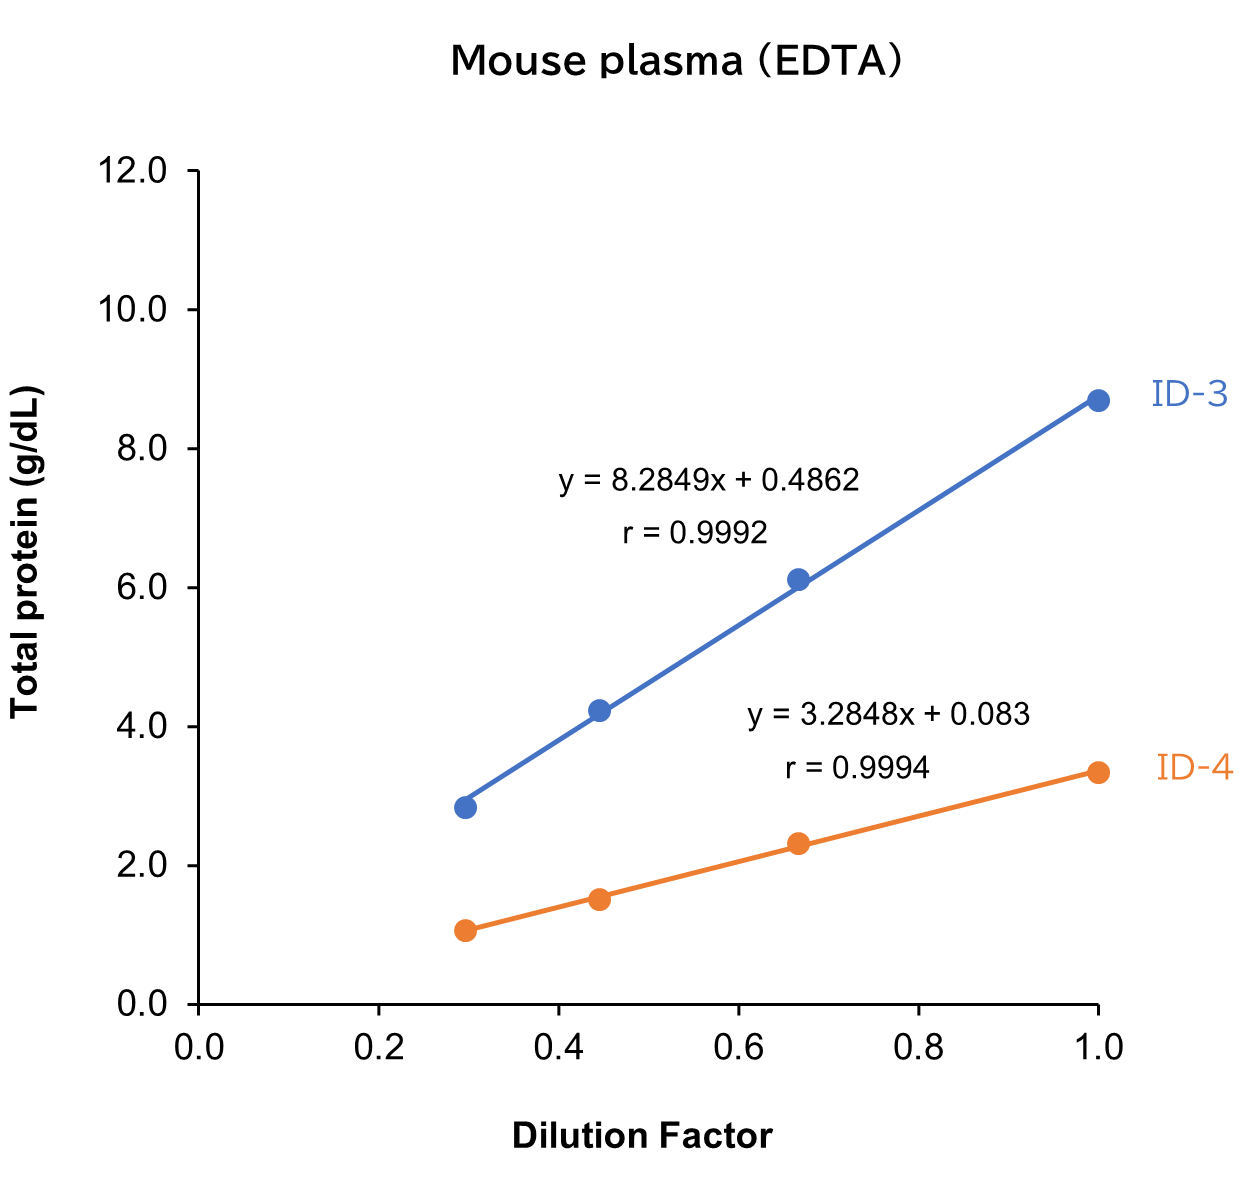
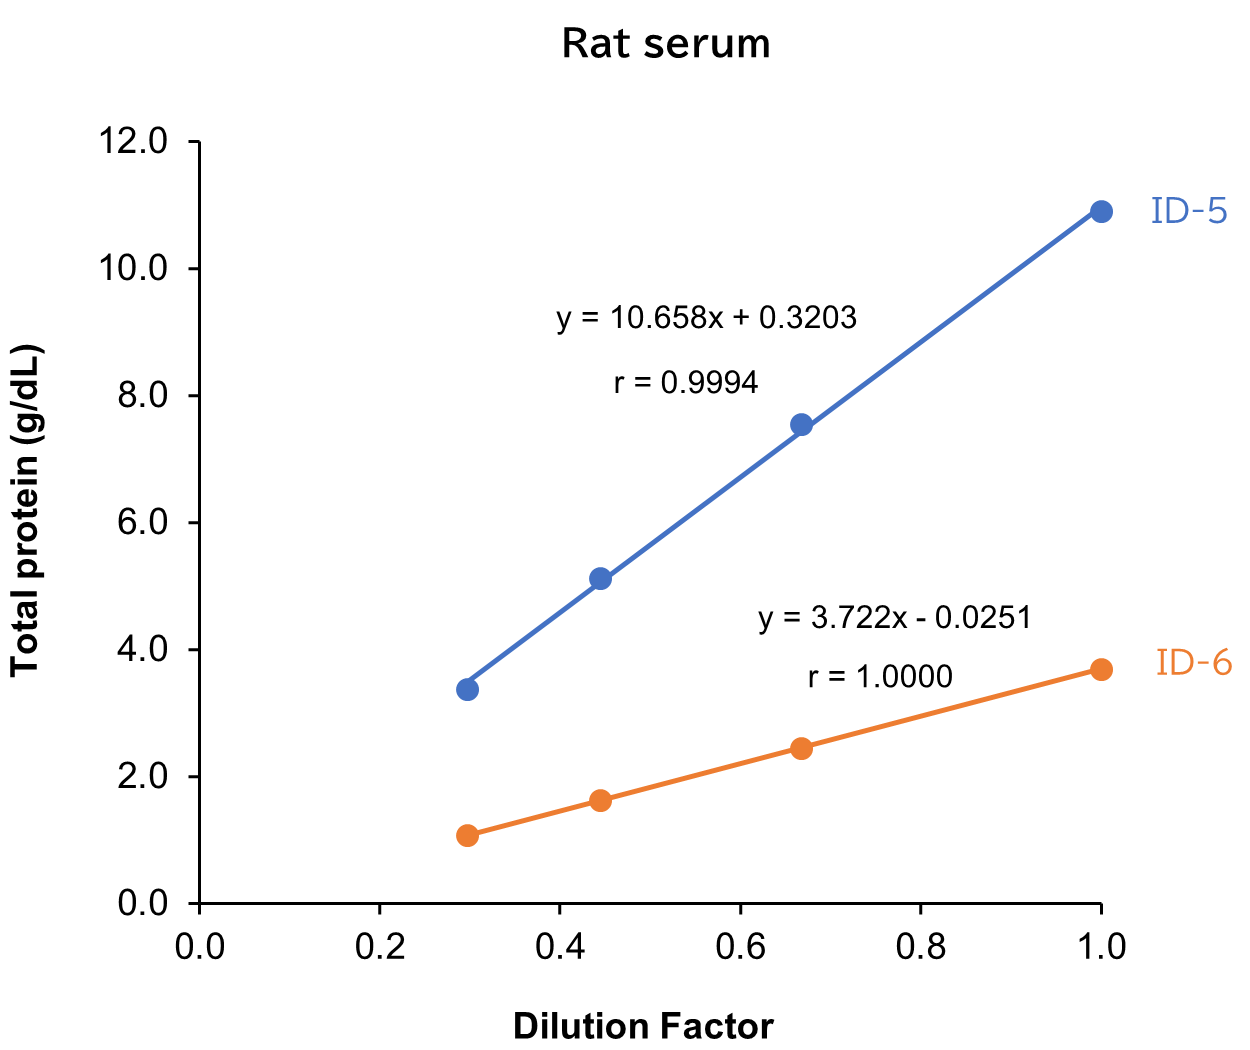
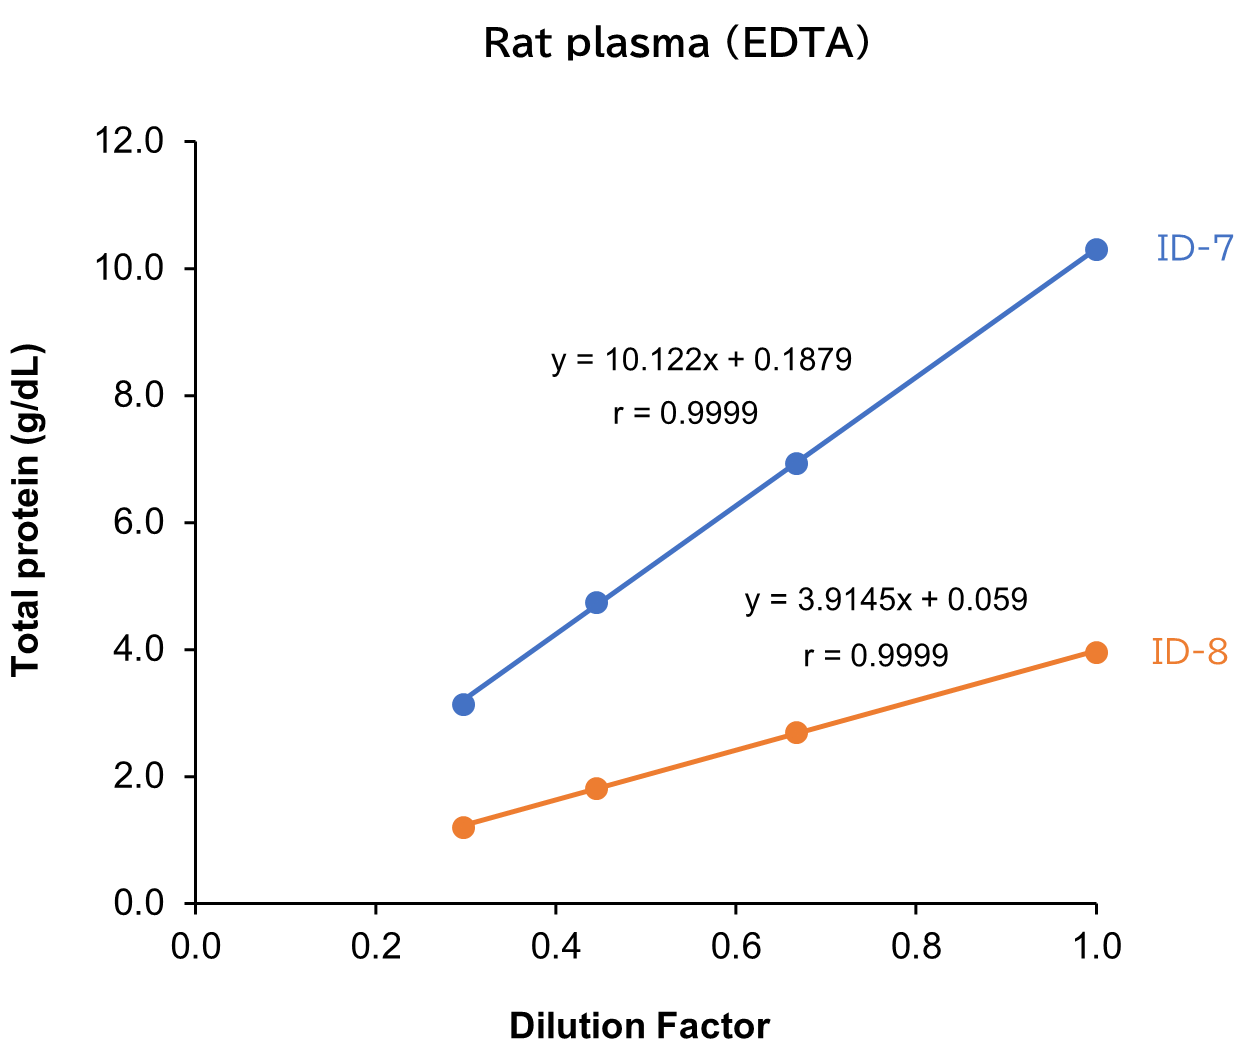
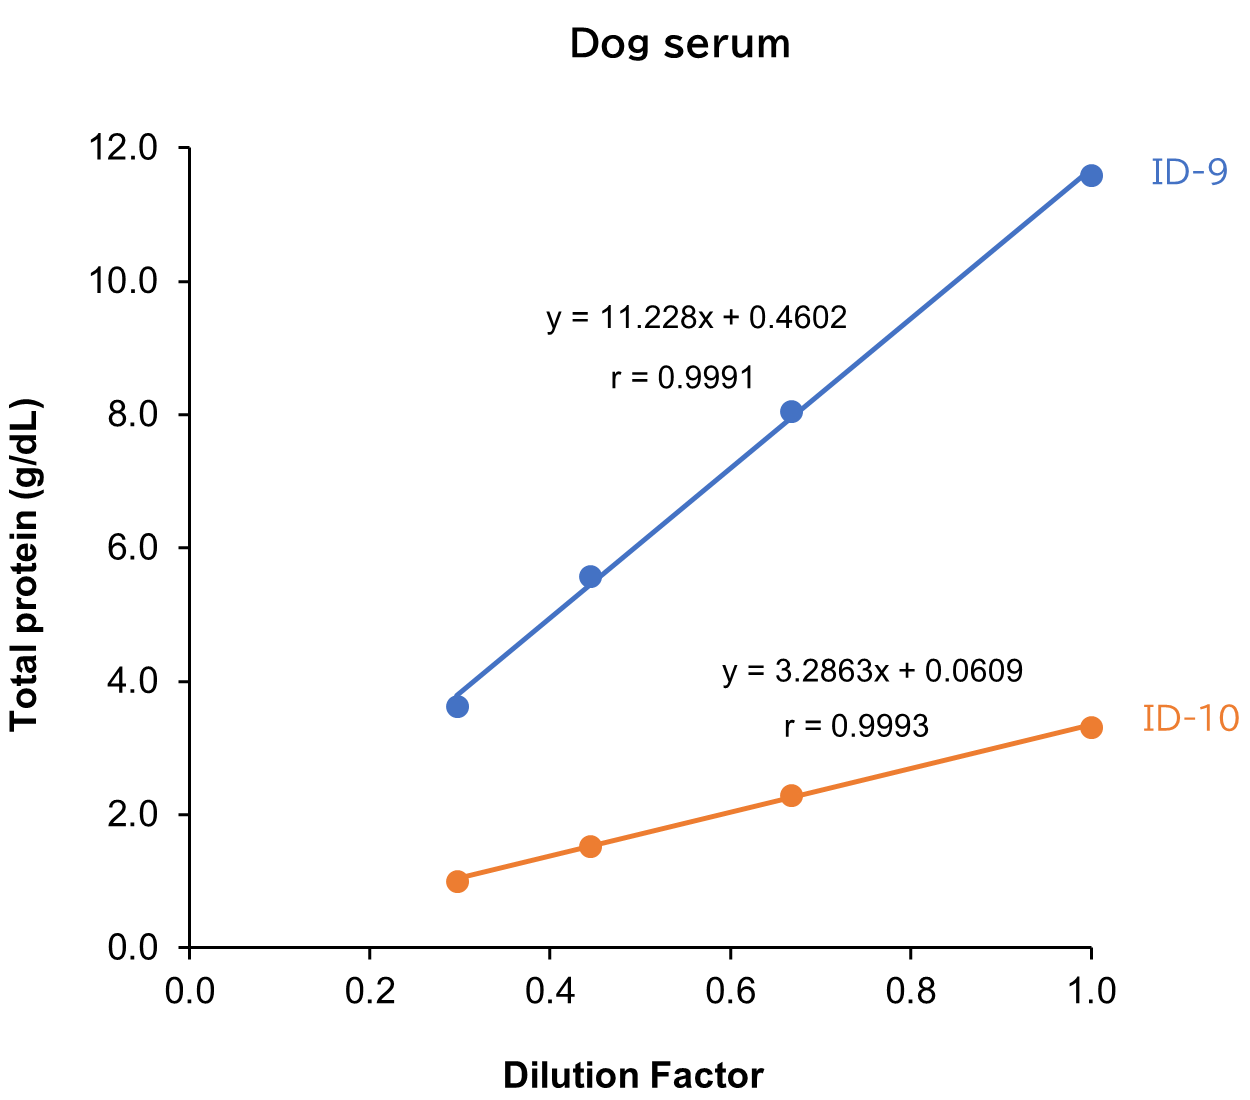
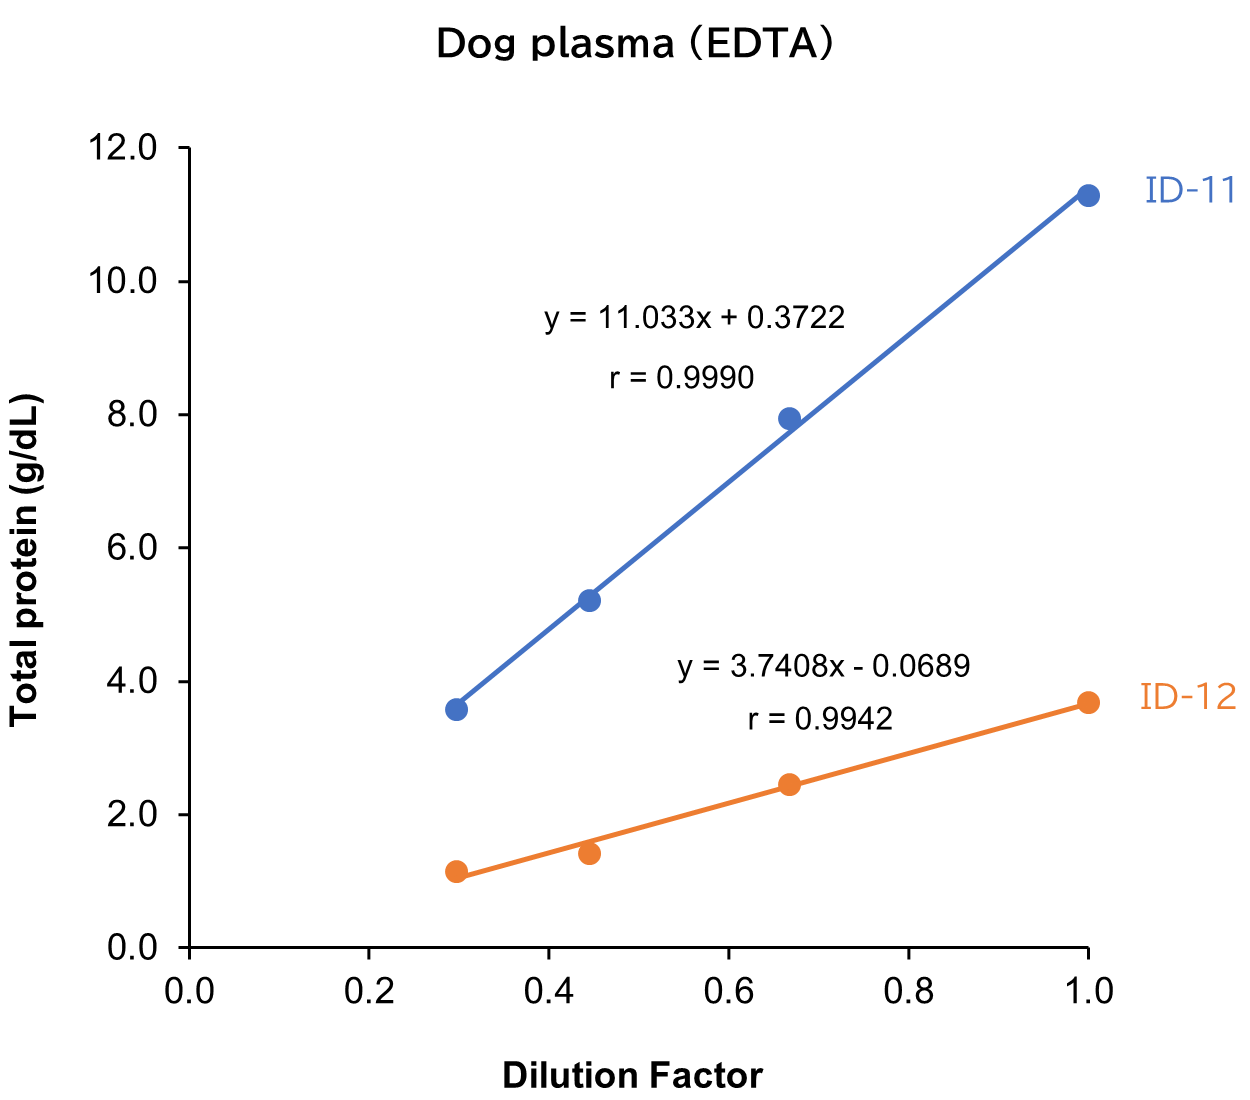
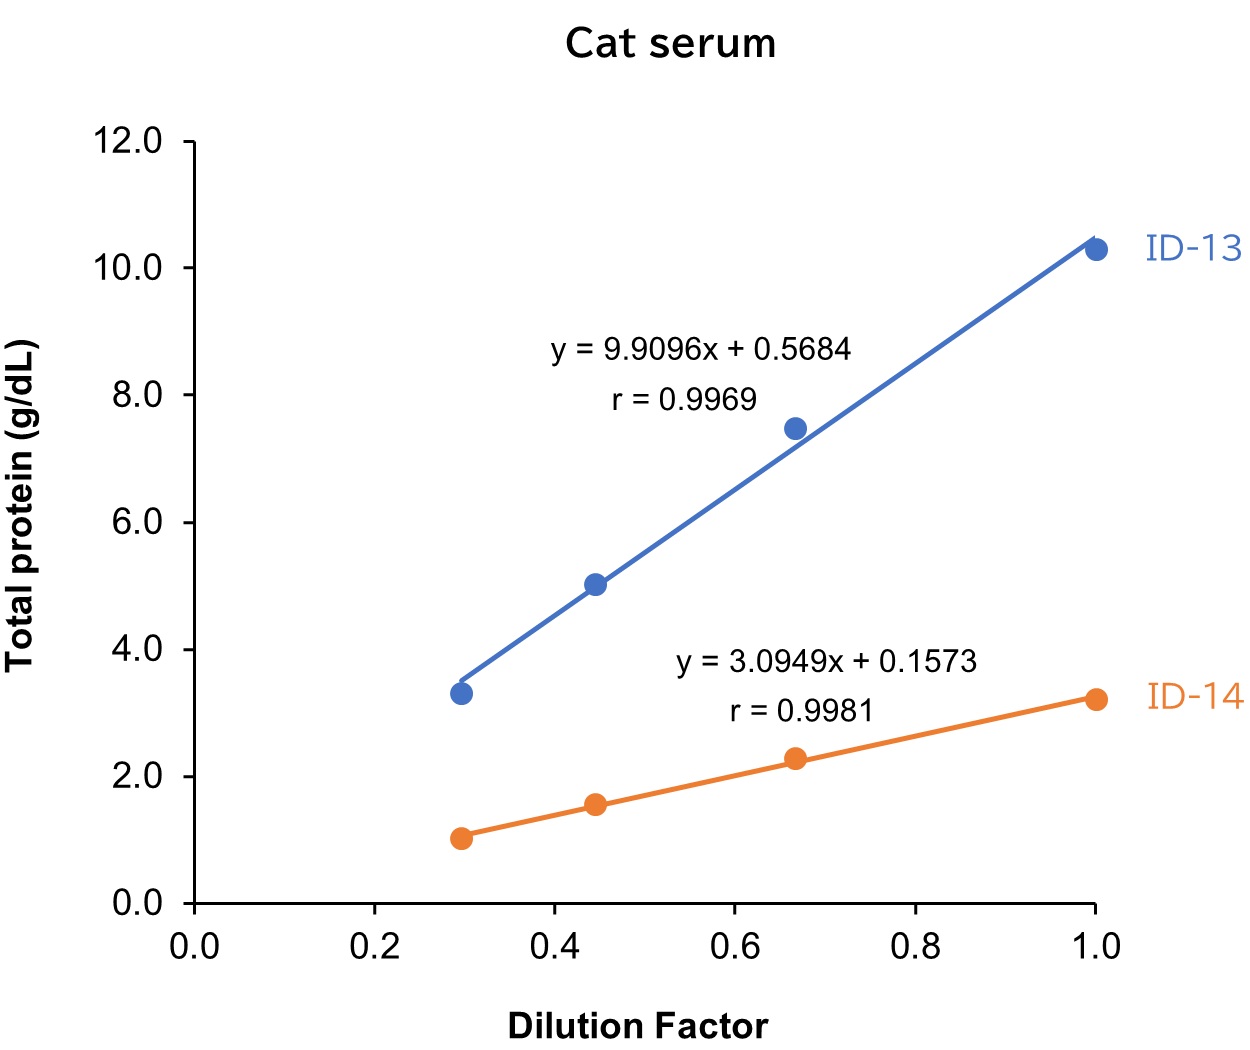
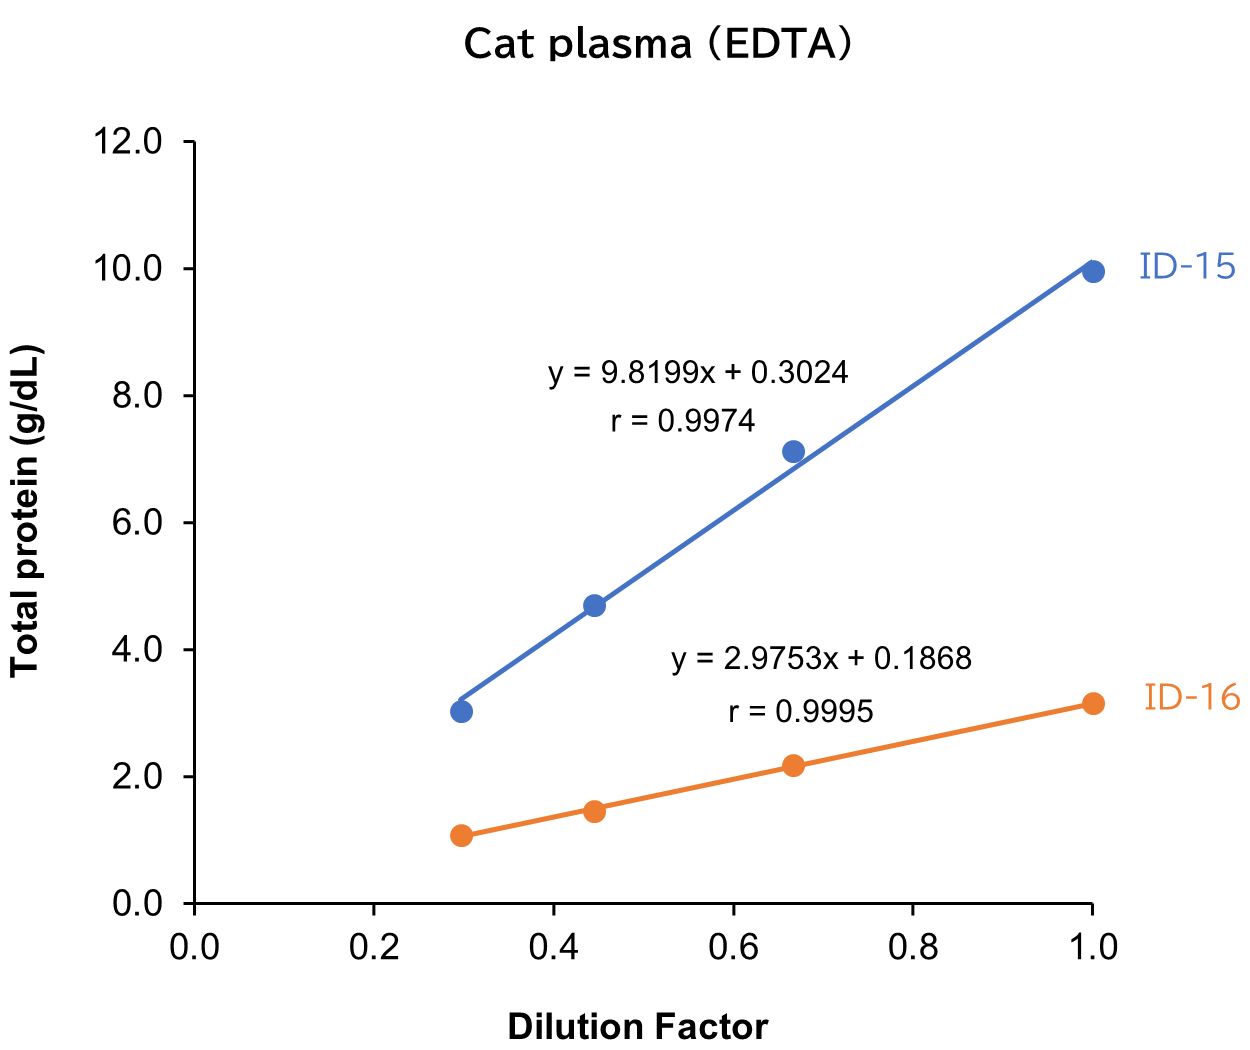
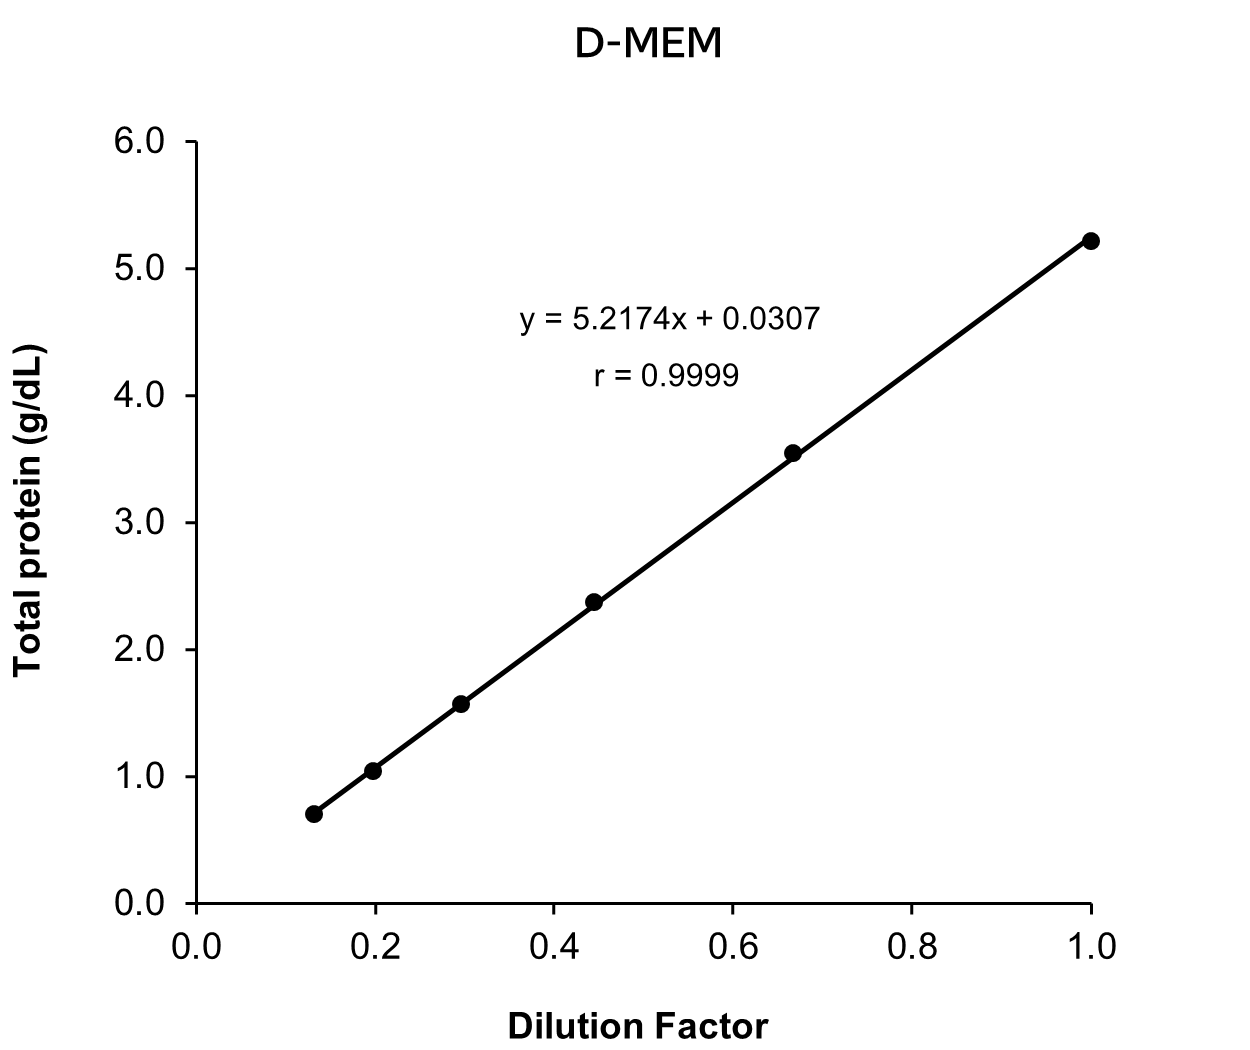
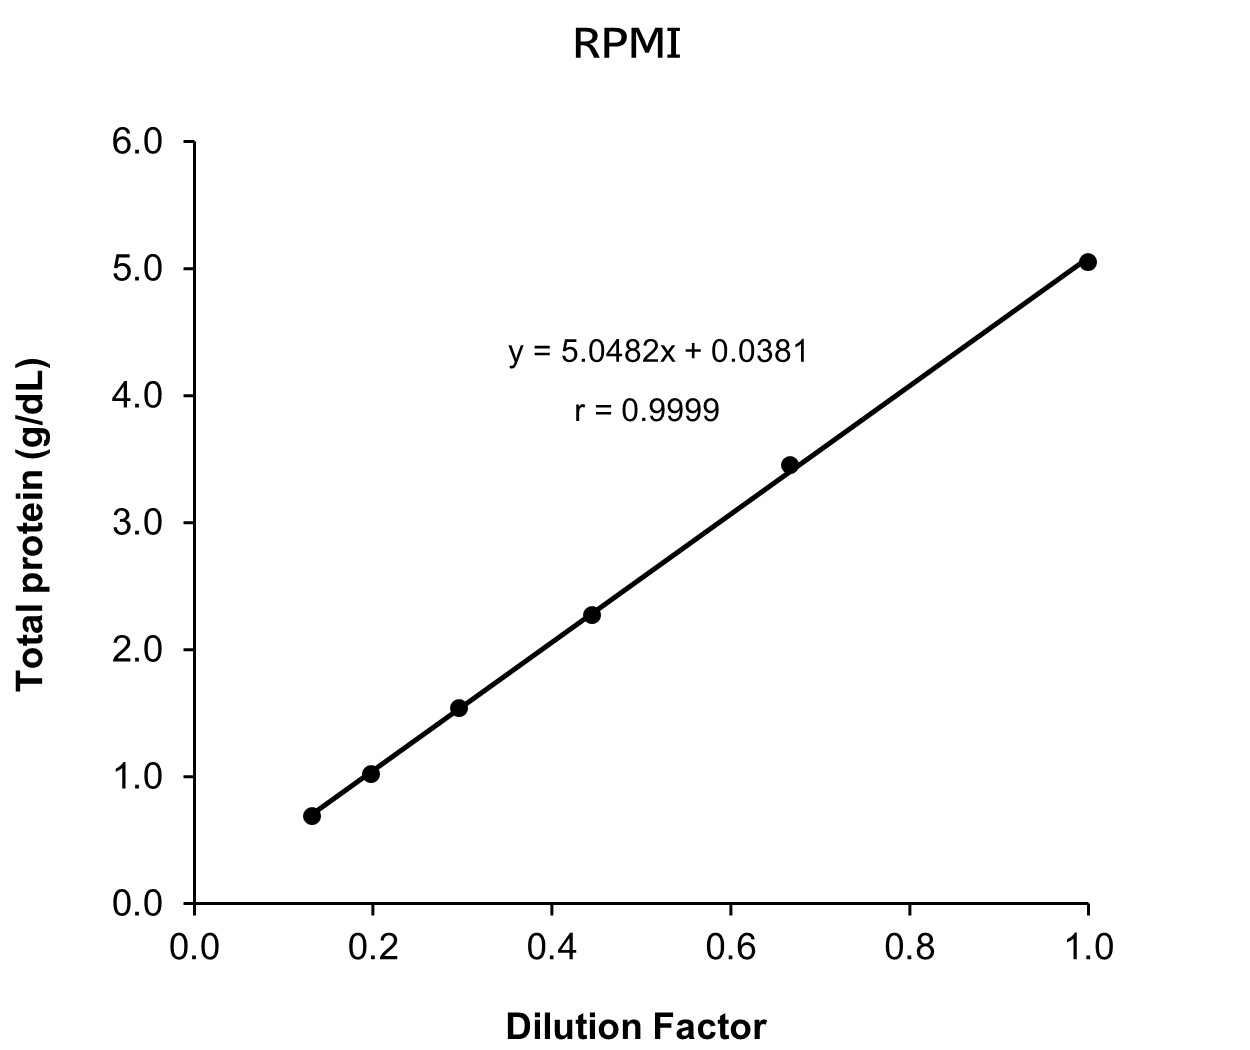
Serum and plasma (EDTA) from human, mouse, rat, dog and cat as well as D-MEM and RPMI spiked with the standard, were serially diluted twofold with the buffer in this kit and measured in duplicate to assess linearity.
[Result]
All measurement results showed good linearity within the measurement range.
Spike and Recovery Test
Standard solutions at three concentrations were added to serum/plasma (EDTA) from human, mouse, rat, dog and cat as well as D-MEM and RPMI. Next, spike recovery tests were conducted, with each measurement performed in duplicate.
Human sample
| Spiked amount (g/dL) | Measurement value (g/dL) | Recovery volume (g/dL) | Recovery rate (%) | |
|---|---|---|---|---|
| Serum | - | 6.86 | - | - |
| 1.56 | 8.38 | 1.52 | 97.4 | |
| 2.34 | 9.26 | 2.40 | 103 | |
| 4.69 | 11.1 | 4.24 | 90.4 | |
| Average | 96.8 | |||
| Plasma (EDTA) | - | 6.83 | - | - |
| 1.36 | 8.08 | 1.25 | 91.9 | |
| 2.05 | 8.80 | 1.97 | 96.1 | |
| 4.09 | 10.7 | 3.87 | 94.6 | |
| Average | 94.2 | |||
Mouse sample (BALB/c)
| Spiked amount (g/dL) | Measurement value (g/dL) | Recovery volume (g/dL) | Recovery rate (%) | |
|---|---|---|---|---|
| Serum | - | 3.76 | - | - |
| 1.11 | 4.88 | 1.12 | 101 | |
| 1.85 | 5.54 | 1.78 | 96.2 | |
| 5.54 | 8.91 | 5.15 | 93.0 | |
| Average | 96.7 | |||
| Plasma (EDTA) | - | 3.58 | - | - |
| 1.12 | 4.67 | 1.09 | 97.3 | |
| 1.86 | 5.30 | 1.72 | 92.5 | |
| 5.58 | 8.78 | 5.20 | 93.2 | |
| Average | 94.3 | |||
Rat sample (S.D. rat)
| Spiked amount (g/dL) | Measurement value (g/dL) | Recovery volume (g/dL) | Recovery rate (%) | |
|---|---|---|---|---|
| Serum | - | 5.82 | - | - |
| 1.38 | 7.16 | 1.34 | 97.1 | |
| 2.25 | 8.06 | 2.24 | 99.6 | |
| 4.21 | 10.3 | 4.48 | 106 | |
| Average | 101 | |||
| Plasma (EDTA) | - | 6.30 | - | - |
| 1.22 | 7.47 | 1.17 | 95.9 | |
| 1.83 | 8.12 | 1.82 | 99.5 | |
| 3.65 | 10.0 | 3.70 | 101 | |
| Average | 98.9 | |||
Dog sample (Beagle)
| Spiked amount (g/dL) | Measurement value (g/dL) | Recovery volume (g/dL) | Recovery rate (%) | |
|---|---|---|---|---|
| Serum | - | 4.31 | - | - |
| 1.21 | 5.42 | 1.11 | 91.7 | |
| 1.61 | 5.89 | 1.58 | 98.1 | |
| 2.41 | 6.87 | 2.56 | 106 | |
| Average | 98.7 | |||
| Plasma (EDTA) | - | 4.86 | - | - |
| 1.23 | 6.00 | 1.14 | 92.7 | |
| 1.64 | 6.56 | 1.70 | 104 | |
| 2.46 | 7.48 | 2.62 | 107 | |
| Average | 101 | |||
Cat sample (Japanese cat)
| Spiked amount (g/dL) | Measurement value (g/dL) | Recovery volume (g/dL) | Recovery rate (%) | |
|---|---|---|---|---|
| Serum | - | 5.34 | - | - |
| 1.37 | 6.63 | 1.29 | 94.2 | |
| 1.82 | 7.21 | 1.87 | 103 | |
| 5.46 | 10.6 | 5.26 | 96.3 | |
| Average | 97.7 | |||
| Plasma (EDTA) | - | 5.05 | - | - |
| 1.38 | 6.57 | 1.52 | 110 | |
| 2.76 | 7.54 | 2.49 | 90.2 | |
| 5.52 | 10.1 | 5.05 | 91.5 | |
| Average | 97.3 | |||
Culture medium
| Spiked amount (g/dL) | Measurement value (g/dL) | Recovery volume (g/dL) | Recovery rate (%) | |
|---|---|---|---|---|
| D-MEM | - | 0.842 | - | - |
| 1.12 | 1.87 | 1.03 | 92.0 | |
| 2.80 | 3.54 | 2.70 | 96.4 | |
| 5.60 | 6.40 | 5.58 | 99.6 | |
| Average | 96.0 | |||
| RPMI | - | 0.00 | - | - |
| 1.10 | 1.05 | 1.05 | 95.5 | |
| 2.76 | 2.61 | 2.61 | 94.6 | |
| 5.52 | 5.20 | 5.20 | 94.2 | |
| Average | 94.7 | |||
[Result]
Good recovery rates were confirmed.
Correlation with Automated Analyzer Reagents
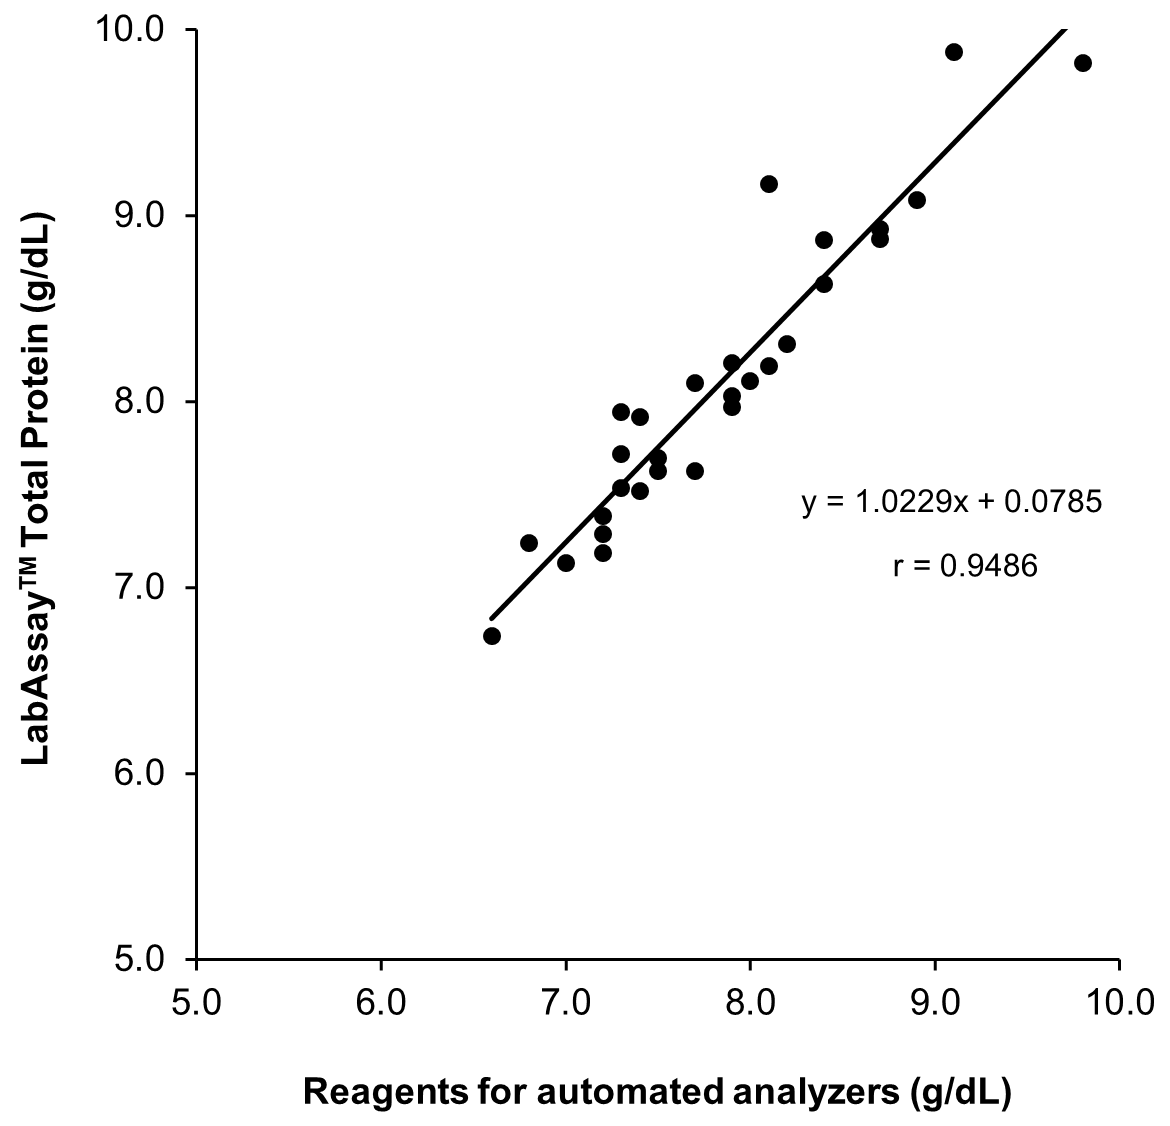
Total protein levels in serum/plasma (EDTA) samples from human were measured using LabAssay™ Total Protein and reagents for automated analyzers, and the correlation between the two sets of results was evaluated.
[Result]
strong correlation was confirmed between the values obtained with LabAssay™ Total Protein and those obtained using reagents for automated analyzers.
Measurement Using Actual Samples
Human sample
| ID\n | Measurement value (g/dL) n=2 (Average) | ||
|---|---|---|---|
| Serum | ID1 | 8.20 | |
| ID2 | 7.19 | ||
| ID3 | 7.95 | ||
| Plasma (EDTA) | ID4 | 6.74 | |
| ID5 | 7.63 | ||
| ID1 | 7.97 | ||
Mouse sample (BALB/c)
| ID\n | Measurement value (g/dL) | mean | SD | CV (%) | ||
|---|---|---|---|---|---|---|
| 1 | 2 | |||||
| Serum | ID1 | 5.03 | 4.93 | 4.98 | 0.0707 | 1.4 |
| ID2 | 5.55 | 5.43 | 5.49 | 0.0849 | 1.5 | |
| ID3 | 5.25 | 5.22 | 5.24 | 0.0212 | 0.4 | |
| Plasma (EDTA) | ID4 | 2.95 | 2.97 | 2.96 | 0.0141 | 0.5 |
| ID5 | 4.86 | 4.76 | 4.81 | 0.0707 | 1.5 | |
| ID1 | 3.13 | 3.13 | 3.13 | 0.00 | 0.0 | |
Rat sample (S.D. rat)
| ID\n | Measurement value (g/dL) | mean | SD | CV (%) | ||
|---|---|---|---|---|---|---|
| 1 | 2 | |||||
| Serum | ID1 | 7.99 | 7.84 | 7.92 | 0.1061 | 1.3 |
| ID2 | 7.32 | 7.38 | 7.35 | 0.0424 | 0.6 | |
| ID3 | 7.56 | 7.65 | 7.61 | 0.0636 | 0.8 | |
| Plasma (EDTA) | ID4 | 6.60 | 6.28 | 6.44 | 0.226 | 3.5 |
| ID5 | 6.50 | 6.52 | 6.51 | 0.0141 | 0.2 | |
| ID1 | 6.36 | 6.19 | 6.28 | 0.120 | 1.9 | |
Dog sample (Beagle)
| ID\n | Measurement value (g/dL) | mean | SD | CV (%) | ||
|---|---|---|---|---|---|---|
| 1 | 2 | |||||
| Serum | ID1 | 6.33 | 6.28 | 6.31 | 0.0354 | 0.6 |
| ID2 | 4.53 | 4.49 | 4.51 | 0.0283 | 0.6 | |
| ID3 | 5.85 | 5.72 | 5.79 | 0.0919 | 1.6 | |
| Plasma (EDTA) | ID4 | 4.75 | 4.70 | 4.73 | 0.0354 | 0.7 |
| ID5 | 4.86 | 5.15 | 5.01 | 0.205 | 4.1 | |
| ID1 | 7.08 | 7.06 | 7.07 | 0.0141 | 0.2 | |
Cat sample (Japanese cat)
| ID\n | Measurement value (g/dL) | mean | SD | CV (%) | ||
|---|---|---|---|---|---|---|
| 1 | 2 | |||||
| Serum | ID1 | 5.32 | 5.58 | 5.45 | 0.184 | 3.4 |
| ID2 | 6.24 | 6.16 | 6.20 | 0.0566 | 0.9 | |
| ID3 | 6.56 | 6.52 | 6.54 | 0.0283 | 0.4 | |
| Plasma (EDTA) | ID4 | 6.01 | 5.91 | 5.96 | 0.0707 | 1.2 |
| ID5 | 5.05 | 5.12 | 5.09 | 0.0495 | 1.0 | |
| ID1 | 4.46 | 4.37 | 4.42 | 0.0636 | 1.4 | |
Example Calculation of the Albumin-to-Globulin Ratio (A/G Ratio)
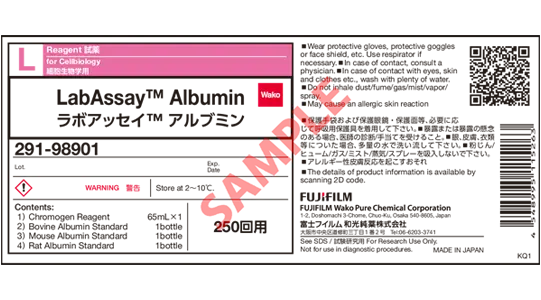
The blood A/G ratio can be determined by using LabAssay™ Total Protein (this product) in conjunction with LabAssay™ Albumin (Product No. 291-98901). The A/G ratio expresses the proportion of albumin to globulin, where globulin is defined as total protein minus albumin. The formula is shown below, along with representative calculations for human, mouse, rat, dog, and cat samples.

Human sample
| Sample | No. | Total protein (g/dL) | Albumin* (g/dL) | A/G ratio |
|---|---|---|---|---|
| Serum | 1 | 8.50 | 5.17 | 1.6 |
| 2 | 7.43 | 5.11 | 2.2 | |
| 3 | 9.74 | 5.80 | 1.5 | |
| Plasma (EDTA) | 4 | 7.48 | 4.50 | 1.5 |
| 5 | 8.52 | 5.52 | 1.8 | |
| 6 | 8.93 | 5.61 | 1.7 |
Mouse sample (BALB/c)
| Sample | No. | Total protein (g/dL) | Albumin* (g/dL) | A/G ratio |
|---|---|---|---|---|
| Serum | 1 | 4.98 | 3.40 | 2.2 |
| 2 | 5.49 | 3.88 | 2.4 | |
| 3 | 5.23 | 2.68 | 1.1 | |
| Plasma (EDTA) | 4 | 2.96 | 1.88 | 1.7 |
| 5 | 4.81 | 2.34 | 1.0 | |
| 6 | 3.13 | 1.95 | 1.6 |
Rat sample (S.D. rat)
| Sample | No. | Total protein (g/dL) | Albumin* (g/dL) | A/G ratio |
|---|---|---|---|---|
| Serum | 1 | 7.91 | 3.97 | 1.0 |
| 2 | 7.35 | 3.79 | 1.1 | |
| 3 | 7.61 | 3.59 | 0.9 | |
| Plasma (EDTA) | 4 | 6.44 | 3.54 | 1.2 |
| 5 | 6.51 | 3.49 | 1.2 | |
| 6 | 6.28 | 3.39 | 1.2 |
Dog sample (Beagle)
| Sample | No. | Total protein (g/dL) | Albumin* (g/dL) | A/G ratio |
|---|---|---|---|---|
| Serum | 1 | 6.31 | 3.46 | 1.2 |
| 2 | 4.51 | 2.64 | 1.4 | |
| 3 | 5.78 | 3.11 | 1.2 | |
| Plasma (EDTA) | 4 | 4.73 | 2.81 | 1.5 |
| 5 | 5.01 | 2.59 | 1.1 | |
| 6 | 7.07 | 2.78 | 0.7 |
Cat sample (Japanese cat)
| Sample | No. | Total protein (g/dL) | Albumin* (g/dL) | A/G ratio |
|---|---|---|---|---|
| Serum | 1 | 5.45 | 2.72 | 1.0 |
| 2 | 6.20 | 3.13 | 1.0 | |
| 3 | 6.54 | 3.08 | 0.9 | |
| Plasma (EDTA) | 4 | 5.96 | 3.03 | 1.0 |
| 5 | 5.08 | 2.20 | 0.8 | |
| 6 | 4.41 | 2.40 | 1.2 |
- Albumin was measured using our LabAssay™ Albumin (Product No. 291-98901).